It is beyond the scope of this paper to describe the details of a fiber interferometer. This has been done elsewhere (Coudé du Foresto 1994). What is shown here is only a conceptual description of a FLUOR-type instrument (Fig. 1 (click here)) and the principles of operation.
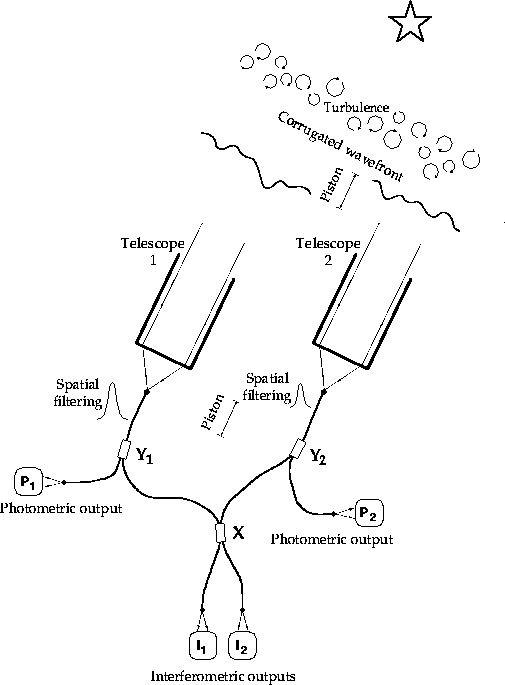
Figure 1: Conceptual design of a stellar fiber interferometer
Two different pupils independently collect the radiation from an astronomical source, and each telescope focuses the light onto the input head of a single-mode optical fiber.
The observed object is considered as unresolved by a single pupil and its
spectral intensity distribution at the focus of the telescopes is ![]() , with
, with ![]() normalized so that
normalized so that
![]()
Starlight injection into the waveguide occurs as the focal electric field
E![]() excites the fundamental mode of the
fiber E
excites the fundamental mode of the
fiber E![]() . The instantaneous coupling
efficiency
. The instantaneous coupling
efficiency ![]() is determined by the overlap integral between the
distribution of the electric fields in the focal plane and in the guided
mode (Shaklan & Roddier 1988):
is determined by the overlap integral between the
distribution of the electric fields in the focal plane and in the guided
mode (Shaklan & Roddier 1988):
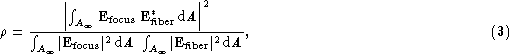
where the integration domain extends at infinity in a transverse plane and
the symbol ![]() denotes a complex conjugate.
denotes a complex conjugate.
The radiation is then guided by the fiber down to the recombination point,
where correlation between the two beams occurs in a single-mode directional
coupler (X). The two complementary outputs of the coupler are measured by
photometers which produce the interferometric signals ![]() and
and
![]() . Two auxiliary couplers
. Two auxiliary couplers ![]() and
and ![]() derive part of the light at
each telescope so that the coupling fluctuations can be monitored by the
photometers which produce the photometric signals
derive part of the light at
each telescope so that the coupling fluctuations can be monitored by the
photometers which produce the photometric signals ![]() and
and ![]() .
.
With a delay line, the observer has the capacity to control the overall optical pathlength difference (OPD) from the source to the recombination point. During data acquisition, the OPD is scanned around the zero pathlength difference. The nominal scanning speed v is the algebraic sum of the internal OPD modulation introduced by the delay line and the external OPD modulation due to diurnal motion.
Thus a complete data set for a single interferogram contains the collection
of four signals ![]() ,
, ![]() ,
, ![]() and
and ![]() , sampled and digitized during
a scan. It also includes the background current sequences for each
photometer (the sum of the dark current and the background signal), which
are preferably acquired just after each scan. It is assumed in what follows
that the electrical offsets have been adjusted in such a way that the
average value of all background currents is zero. To reduce statistical
errors on the results, a batch of a few tens to a few hundred
interferograms is recorded for a given source and instrumental
configuration.
, sampled and digitized during
a scan. It also includes the background current sequences for each
photometer (the sum of the dark current and the background signal), which
are preferably acquired just after each scan. It is assumed in what follows
that the electrical offsets have been adjusted in such a way that the
average value of all background currents is zero. To reduce statistical
errors on the results, a batch of a few tens to a few hundred
interferograms is recorded for a given source and instrumental
configuration.
A simple example, using a monochromatic source at wave number ![]() ,
will help us understand how fiber interferograms can be corrected from the
turbulence induced coupling fluctuations. Neglecting transmission and
proportionality factors that are detailed in Sect. 4 (click here), the expression of a generic interferogram I is
,
will help us understand how fiber interferograms can be corrected from the
turbulence induced coupling fluctuations. Neglecting transmission and
proportionality factors that are detailed in Sect. 4 (click here), the expression of a generic interferogram I is
![]()
where ![]() is the modulus of the complex coherence factor, x the optical
path difference, and
is the modulus of the complex coherence factor, x the optical
path difference, and ![]() a phase term. From this and with the knowledge
of
a phase term. From this and with the knowledge
of ![]() and
and ![]() , it is easy to build the corrected interferogram whose
modulated part is:
, it is easy to build the corrected interferogram whose
modulated part is:
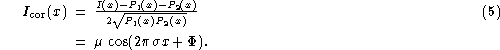
The quantity ![]() is the normalized interferogram
that would have been observed if there had been no atmospheric turbulence,
i.e. if
is the normalized interferogram
that would have been observed if there had been no atmospheric turbulence,
i.e. if ![]() and
and ![]() had been equal and constant.
had been equal and constant.
In Sect. 5 (click here) is established a more rigorous expression of the interferogram for a monochromatic and for a wide band source.