In the following paragraphs the different observational inputs which enter the application of the IRFM are commented on.
The determination of monochromatic fluxes at wavelengths of the IR continuum requires two observational inputs: Firstly, the measurement of IR photometry for the problem stars with respect to a standard,
and secondly the absolute flux calibration of the standard star. Then, entering the IR magnitudes measured
in Eq. (2), we obtain monochromatic fluxes at ![]() ,
, ![]() ,
, ![]() and
and ![]() for each star in the sample.
for each star in the sample.
In Paper II, a semi-empirical method was devised to determine the absolute calibration of the flux of Vega in the near-IR (from J to L'). This absolute calibration places temperatures derived applying the IRFM with Kurucz's models on the same scale as mean direct temperatures derived from angular diameter measurements. It is worth noting the good agreement (within 1%) with the semi-empirical calibration for Vega provided by Walker & Cohen (1992), the theoretical one by Dreiling & Bell (1980) and the "self-consistent'' calibration by Blackwell et al. (1990).
The errors in the absolute IR flux calibration have different effects on the temperatures derived by mean of the IRFM, depending on the photometric band. The errors in the absolute IR flux calibration were estimated at 3% in the J band, 4% in H and K bands and 5% in L' band (Paper II). Over 4000 K, the net effect of this systematic uncertainty is a drift of the temperature scale. If it happens that the above errors correlate in the three (four) bands, the maximum possible variation of the temperature scale would amounts to from 1.2% at 8000 K to 1.7% at 4000 K (1.3-1.7%) over 4000 K. However, if as it is more likely, the errors in the three (four) bands are uncorrelated, the net effect of the uncertainty of the absolute calibration would be an approximately constant shift in the zero point over the whole temperature range amounting to at most 0.9%. Although the indeterminacy of the zero point of the scale is common to all kind of methods used to derive effective temperatures, the method adopted in Paper II to fix the absolute calibration of the flux in the near IR was designed in order to minimising this error.
The programme
of broad-band photometry in the near-IR is described in Paper IV. J, H, K (and L') magnitudes
were
measured for 70% of the stars in the sample, with a mean accuracy of the order
of 0.01-0.02 mag for J, H, K and 0.04 mag for L'. For the remainder of the stars, the photometry
was obtained from the literature and transformed
to the system of the TCS in order to compute near-IR monochromatic fluxes.
The isolated effect of the photometric errors
on the ![]() determination can be inferred from Tables 1-4, taking
Eq. (3) into account.
determination can be inferred from Tables 1-4, taking
Eq. (3) into account.
For the range of spectral types studied in the present work, nearly
all the flux arriving at the earth atmosphere passes through the
atmospheric windows. When comparing ![]() derived directly
from calibrated spectra to
derived directly
from calibrated spectra to ![]() obtained by integrating UBVRI
photometry, Petford et al. (1988) report an accuracy of the order
of 2%. Therefore, the bolometric flux might be obtained for each
star in the sample from broad-band photometry. However, photometric
calibrations of the type provided by
Blackwell & Petford (1991) and Blackwell & Lynas-Gray (1998)
represent a more practical and accurate approach. We have obtained
calibrations of this kind by fitting the bolometric fluxes of 184 stars
of the sample, well distributed in
metallicity, as a function of K, (V-K) and [Fe/H]. Bolometric
fluxes (
obtained by integrating UBVRI
photometry, Petford et al. (1988) report an accuracy of the order
of 2%. Therefore, the bolometric flux might be obtained for each
star in the sample from broad-band photometry. However, photometric
calibrations of the type provided by
Blackwell & Petford (1991) and Blackwell & Lynas-Gray (1998)
represent a more practical and accurate approach. We have obtained
calibrations of this kind by fitting the bolometric fluxes of 184 stars
of the sample, well distributed in
metallicity, as a function of K, (V-K) and [Fe/H]. Bolometric
fluxes (![]() ) have been obtained by integrating UBVRIJHK
photometry. The percentage of
) have been obtained by integrating UBVRIJHK
photometry. The percentage of
![]() measured in U--K bands ranges from 80% to 90%
for the giant stars contained in our sample. The energy outside that
wavelength range (i.e. UV and far IR flux) has been estimated
with the help of models as described thoroughly in Paper III. The low
dispersion of the fits grants the overall level of accuracy expected for the final temperatures derived in this work
measured in U--K bands ranges from 80% to 90%
for the giant stars contained in our sample. The energy outside that
wavelength range (i.e. UV and far IR flux) has been estimated
with the help of models as described thoroughly in Paper III. The low
dispersion of the fits grants the overall level of accuracy expected for the final temperatures derived in this work![]() . The result of the calibration
for
. The result of the calibration
for ![]() is
is
 |
||
| (4) | ||
 |
||
| (5) | ||
The corresponding bolometric correction for
![]() magnitudes for giant stars obtained from Eqs. (4)
and (5) is listed in Table 5, where the validity range of the
calibration, in colour and metallicity,
is shown. The differences
from the bolometric correction obtained by applying the same
method to main sequence stars are in the range 0.01-0.05 mag (Fig. 3).
magnitudes for giant stars obtained from Eqs. (4)
and (5) is listed in Table 5, where the validity range of the
calibration, in colour and metallicity,
is shown. The differences
from the bolometric correction obtained by applying the same
method to main sequence stars are in the range 0.01-0.05 mag (Fig. 3).
In Fig. 4 we show the difference
between bolometric corrections or fluxes derived here, and those from
the following authors:
This work comprehensively provides bolometric corrections synthesized from different grids of stellar model fluxes of solar metallicity. The comparison of the BC(K) scales in Fig. 4a shows a consistent agreement in the range (V-K)=1.4-3.6. However, in the borders of the colour range of our calibration differences increase. The discrepancies at the cooler edge of the temperature scale point are probably connected with the limitations of Kurucz's (1993) models under 4500-4000 K, however the reason for the discrepancy at the hotter edge is unclear.
This work presents a re-analysis of the results of Blackwell & Petford (1991) by using the same techniques. In Fig. 3c, we show the ratio of our bolometric flux to that of BL98 versus temperature for 50 giants common to both works. The mean difference is 1.4% (BL98 fluxes greater) with a dispersion of 1.7%. No appreciable trend with temperature is observed in the range 4000-8000 K. The offset is probably related to the different absolute flux calibrations adopted.
This study provides a thorough analysis of the bolometric
correction based on measurements of 335 stars compiled from the
literature. For 37 giants common with our sample (mainly Population I stars), we have transformed the BC(V) provided
in Table 3 of F96 to BC(K) adopting the following parameters for the Sun:
BC![]() and
and ![]() . From the comparison,
two main features can be observed in Fig. 4b. The differences show a
conspicuous slope with
colour. The probable
reason for this trend is coupled with the different temperature scales
adopted
in both studies. Furthermore the scatter about the mean line of
differences is slightly larger (
. From the comparison,
two main features can be observed in Fig. 4b. The differences show a
conspicuous slope with
colour. The probable
reason for this trend is coupled with the different temperature scales
adopted
in both studies. Furthermore the scatter about the mean line of
differences is slightly larger (![]() %)
than expected if one sums in quadrature the internal errors of both works. The explanation of this point, apart from the different temperature scales used
implicity in the calculation, may be partly related to the inhomogeneity
of the F96 sample and partly to the uncertainties introduced by the transformation from BC(V) to BC(K).
%)
than expected if one sums in quadrature the internal errors of both works. The explanation of this point, apart from the different temperature scales used
implicity in the calculation, may be partly related to the inhomogeneity
of the F96 sample and partly to the uncertainties introduced by the transformation from BC(V) to BC(K).
This study is based on a method similar to that applied here using instead
13-colour, UV and broad-band near-IR photometry. There are 21 common
stars whose fluxes appear to be shifted 6% with a dispersion of 1.7%
(Fig. 4c) from ours. This difference is probably connected with the absolute flux
calibration and the photometric calibration of the 13-colour system. Notice that BG89 fluxes are also shifted 4-5% with respect to those of
BL98, so that the relative differences with our work are consistent.
In summary, the agreement of the bolometric fluxes derived here for solar metallicity stars is within the error-bars expected from the sources of uncertainty affecting the various methods: errors in the absolute calibrations adopted in the optical and IR ranges, differences in the atmosphere models grids. It is worth noting at this point that a 3% error on the bolometric flux implies a 1% error in the temperature derived by mean of the IRFM.
![\begin{figure}
\includegraphics [width=8.8cm]{ds1675f4.ps}\end{figure}](/articles/aas/full/1999/17/ds1675/Timg59.gif) |
Figure:
a) Difference between the bolometric correction to |

|

|

|

|

|

|
As for the stars of globular clusters, we have adopted an average
of the most reliable values quoted in literature, and, except for M 71, we
have restricted our analysis to low reddening clusters.
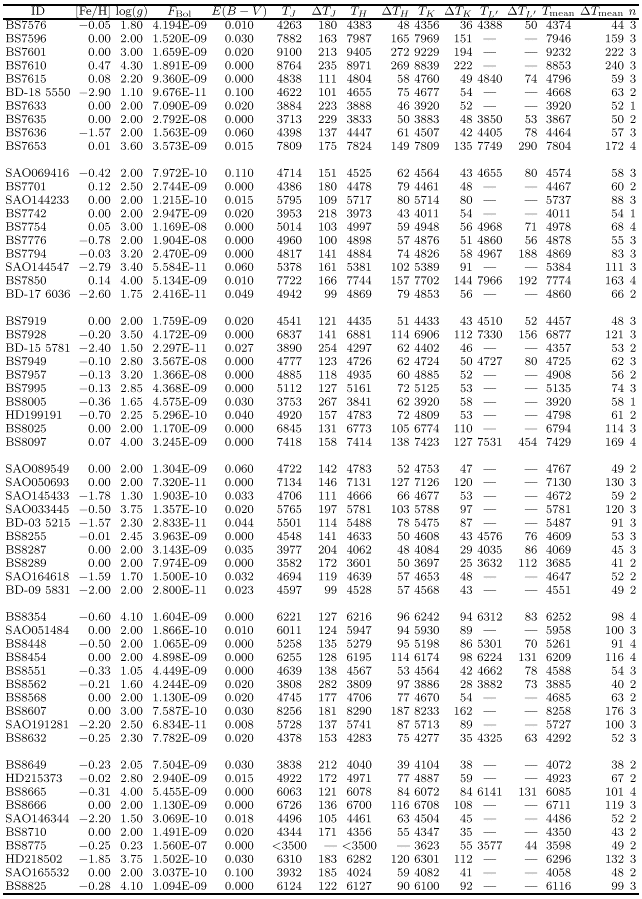
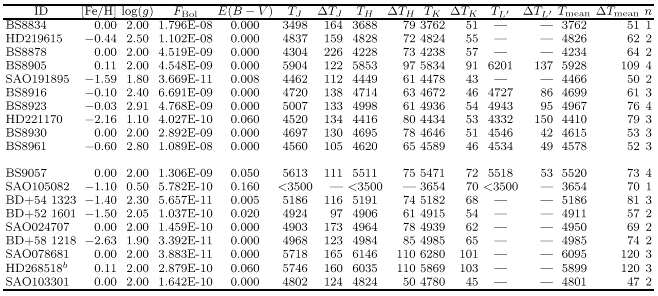
In Tables 6 and 7 we present the reddening correction
applied to the stars of the sample. It is worth noticing that a third of the
field stars of the sample needed a reddening correction ![]() , and that
, and that
![]() 10% of them have
10% of them have ![]() .
.
The change in temperature induced by
E(B-V)=0.05 mag when applying the IRFM varies from 2.1% at 3500 K to
4.5% at 7500 K. The hotter the star the stronger the effect since
the proportion of flux radiated in the visible/UV wavelength range is greater.
The effective temperature determination by means of Eq. (3) requires an estimate of the stellar metallicity and surface gravity. These parameters, however, need not be very accurate as mentioned in Sect. 3.1. In particular, it may be concluded that 0.5 dex and 0.3 dex uncertainties in log(g) and [Fe/H], respectively, are sufficient to obtain temperatures to an accuracy of 1-2% (see Fig. 2). Therefore, as far as the surface gravity is concerned, it is enough to consider an average surface gravity according to the spectral type, although spectroscopic determinations of surface gravities have been adopted when available from literature.
A number of stars in the sample had their metal
abundance determined from
fine spectroscopic analysis included in the Catalogue of
[Fe/H] determinations of Cayrel de Strobel et al. (1997) with a
mean accuracy within 0.15 dex. We have preferred these determinations,
but for stars lacking spectroscopic analysis, photometric metallicity
calibrations based on Strömgren photometry
(Anthony-Twarog & Twarog 1994),
and on ![]() index (Carney 1979), with
accuracies oscillating between 0.20-030 dex, were used.
index (Carney 1979), with
accuracies oscillating between 0.20-030 dex, were used.
The adopted gravities and metallicities are listed in Tables 6 and 7.
Copyright The European Southern Observatory (ESO)