
Up: A 1.4 GHz radio
From the observation and the method of data reduction it is obvious
that neither the total intensity nor the polarization maps are on an
absolute temperature scale. The total intensity maps are calibrated to
an absolute scale using the 1.4 GHz northern sky survey by Reich
(1982) and Reich & Reich (1986)
carried out with the Stockert 25-m telescope. This procedure has already
been described by Reich et al. (1990) when
calibrating the Effelsberg 1.4 GHz Galactic plane survey. The Stockert
survey has a scale accuracy of 5% and an uncertainty of the absolute
zero-level of 0.5 K.
Briefly, the Effelsberg data and the Stockert data are convolved to an
angular resolution slightly exceeding that of the Stockert 1.4 GHz
survey (HPBW 36 ) and the difference between the two data sets is
added to the Effelsberg data. This procedure also improves the
original Effelsberg maps since large-scale distortions by atmospheric
and ground radiation variations are removed.
However, still existing faint baseline effects in the low resolution
Stockert data are also added to the higher resolution Effelsberg data.
Such distortions were found to exist on small scales but not on the
large-scale background component, which is the missing component of the
Effelsberg maps. A modified version to calibrate the Effelsberg
maps absolutely was introduced:

- Convolve the Effelsberg map to the resolution of the
Stockert map (36
 ). Decompose this map into a large-scale
component (Eff.back) and a map with small-scale structures using the
"background filtering method'' (Sofue & Reich
1979) with a
  Gaussian beam for smoothing.

- Subtract the 2.8 K isotropic background component from the
Stockert data and convert the temperature scale from full beam into
main beam (
 ).
).

- Decompose the Stockert data to obtain the corresponding
large-scale component (Sto.back) by using the same filtering
parameters as for the Effelsberg data.

- Adjust Eff.back to Sto.back as described above,
namely, add the difference of both large-scale component maps to the
Effelsberg large-scale data and add the 2.8 K isotropic background
component. The resulting map is ES.back.

- The final Effelsberg map (Eff.final) is given by:
Eff.final = Eff.orig + ES.back - Eff.back.
 |
Figure 2:
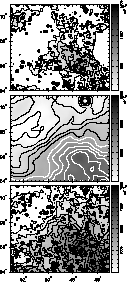
A small section from the survey, towards  , illustrates the calibration of the total intensity data to the
absolute temperature scale. The panels, from top to bottom, display the
Effelsberg (contours start at 100 mK and are plotted in 150 mK steps)
and Stockert 1.4 GHz (contours start at 4500 mK in 100 mK steps, full
beam brightness scale) measurements and the combination of the two,
respectively. Contours for the combined map (bottom) run from 5500 mK
in steps of 150 mK , illustrates the calibration of the total intensity data to the
absolute temperature scale. The panels, from top to bottom, display the
Effelsberg (contours start at 100 mK and are plotted in 150 mK steps)
and Stockert 1.4 GHz (contours start at 4500 mK in 100 mK steps, full
beam brightness scale) measurements and the combination of the two,
respectively. Contours for the combined map (bottom) run from 5500 mK
in steps of 150 mK |
We use the modified method only when there are non-negligible
scanning effects in the source component of the Stockert data. A
sample region (towards  ) is given in
Fig. 2 to illustrate the effect of the absolute calibration.


Up: A 1.4 GHz radio
Copyright The European Southern Observatory (ESO)
![]() ) and the difference between the two data sets is
added to the Effelsberg data. This procedure also improves the
original Effelsberg maps since large-scale distortions by atmospheric
and ground radiation variations are removed.
) and the difference between the two data sets is
added to the Effelsberg data. This procedure also improves the
original Effelsberg maps since large-scale distortions by atmospheric
and ground radiation variations are removed.
![]() ) is given in
Fig. 2 to illustrate the effect of the absolute calibration.
) is given in
Fig. 2 to illustrate the effect of the absolute calibration.