An attempt was made to minimize these instrumental effects to a
residual effect of the order of 1%. We assume that the instrumental
components ![]() and
and ![]() scale with the total
intensity I. When observing in an astronomical coordinate system the
instrumental components depend on the parallactic angle
scale with the total
intensity I. When observing in an astronomical coordinate system the
instrumental components depend on the parallactic angle ![]() . A
procedure was developed to correct for this effect. From the
observations of the polarized calibration sources 3C 286 and 3C 138
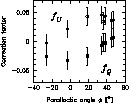
at different parallactic angles, correction factors fU and
fQ are calculated in such way that the nominal percentage
polarization and the polarization angle are obtained.
. A
procedure was developed to correct for this effect. From the
observations of the polarized calibration sources 3C 286 and 3C 138
at different parallactic angles, correction factors fU and
fQ are calculated in such way that the nominal percentage
polarization and the polarization angle are obtained.
The algorithm of the elimination of the instrumental effects is as follows:
Suppose ![]() and
and ![]() are the intrinsic values
of a source in an astronomical coordinate system.
are the intrinsic values
of a source in an astronomical coordinate system. ![]() and
and
![]() are the observed values depending on the parallactic
angle
are the observed values depending on the parallactic
angle ![]() . The instrumental values
. The instrumental values ![]() and
and ![]() are:
are:
 |
(1) | |
 |
(2) | |
![\begin{eqnarray}
f_{U}(\phi) = \frac{\displaystyle {PI}_\mathrm{inst}(\phi)}
{\...
...m{obs}} \cos \left[ 2 ({PA}_\mathrm{inst}(\phi)
- \phi ) \right].\end{eqnarray}](/articles/aas/full/1998/18/ds1502/img34.gif) |
(3) | |
 |
Figure 3: Variation of the calculated fU and fQ factors with respect to the parallactic angle for 3C 286 during one observing session. Error bars are the standard deviations of the factors |
It has been found that the correction effect on the large-scale polarization emission is not significant. Strong sources, however, cause distortions which are clearly minimized by the described procedure. In Fig. 4 we illustrate the effect of our correction procedure. We note that instrumental effects do not always act in a way to increase the observed polarization. Depending on the arrangement and variations in U and Q it is equally possible to observe the reverse of this effect.
Copyright The European Southern Observatory (ESO)