In this section, we illustrate the new test by an application to real data.
The data employed are the  values from Table 5 of
Schmidt (1968), where the data were believed to be uniformly distributed in
the interval [0,1]. Indeed, the mean value of the data is 0.50 (see
Schmidt 1968), and one may verify that the sample passes the K-S test.
values from Table 5 of
Schmidt (1968), where the data were believed to be uniformly distributed in
the interval [0,1]. Indeed, the mean value of the data is 0.50 (see
Schmidt 1968), and one may verify that the sample passes the K-S test.
In this sample, there are 33 data in total. Because some data share the
same value, we have only 28 different values. Let x denote the random
variable . For a uniform distribution from
to 1, the cumulative distribution function is
| f(x)=x. | (29) |
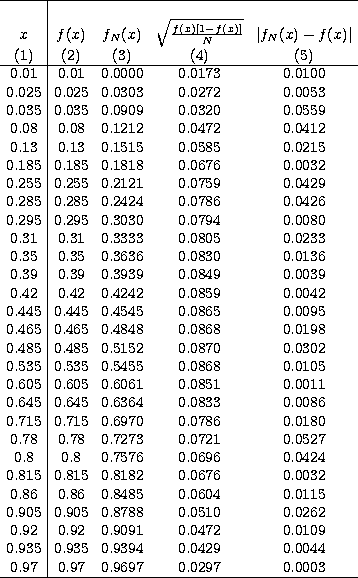
 , calculated by
Eq. (3). Column (4) presents the allowed
, calculated by
Eq. (3). Column (4) presents the allowed  deviation of the
assumed distribution,
deviation of the
assumed distribution, ![${\sqrt{{\frac{f(x)[1-f(x)]}N}}}$](/articles/aas/full/1998/17/ds7271/img59.gif) , and Col. (5)
presents the deviation of the sample from the distribution,
, and Col. (5)
presents the deviation of the sample from the distribution,  .
.
From Table 1 we find that there is one point, i.e. x=0.035, where
condition (9) is not satisfied. Therefore, the sample does not pass the distribution function deviation test for the assumed
distribution according to definition 1.
Copyright The European Southern Observatory (ESO)