The measurements at different epochs at 1.4 GHz (WSRT and NVSS) and at 5 GHz (Greenbank, WSRT and MERLIN) can be used to investigate the variability of the sources in our sample. The measurements are taken with different resolutions, hence if extended emission is present this can contribute to a difference in measured flux densities. In particular at 5 GHz, the Greenbank flux density measurements can be influenced by confusion of background sources in the 3.5' beam. However, in general this effect is small.
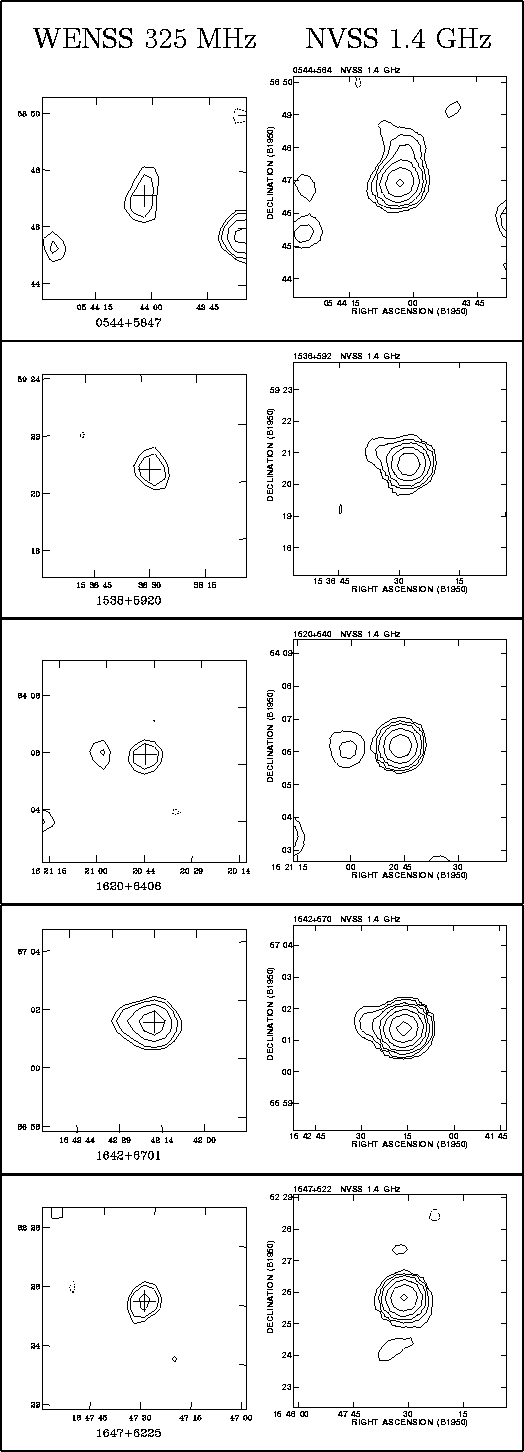 |
Figure 4: The WENSS 325 MHz (left) and the NVSS 1.4 GHz (right) maps of the five GPS sources for which nearby radio components are found in the NVSS |
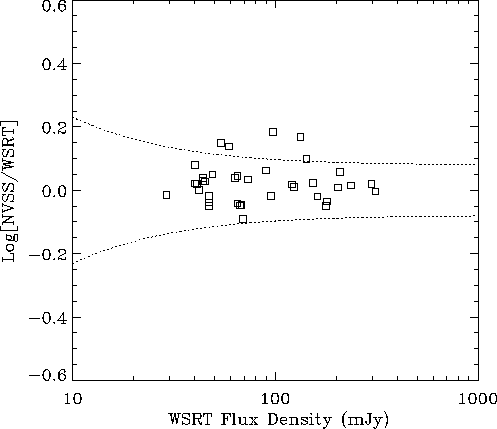
Figure 3 shows the logarithm of the ratio between the 1.4 GHz
NVSS and WSRT flux densities as function of WSRT flux density for the GPS
sources. Note that for only 5 GPS sources (14%) this difference is larger
than ![]() mJy, which can be caused by either variability or extended
emission on scales between 8'' and 35'', or both.
For the sources which were not included in the final GPS sample, the
"non-GPS sources'', the
percentage of objects outside
mJy, which can be caused by either variability or extended
emission on scales between 8'' and 35'', or both.
For the sources which were not included in the final GPS sample, the
"non-GPS sources'', the
percentage of objects outside ![]() mJy is 26%.
None of the objects with a nearby radio source in the NVSS (see Fig. 4) has
a difference between their 1.4 GHz WSRT and NVSS measurements of
mJy is 26%.
None of the objects with a nearby radio source in the NVSS (see Fig. 4) has
a difference between their 1.4 GHz WSRT and NVSS measurements of ![]() .Therefore it seems unlikely that extended emission is causing the
discrepancy between the two 1.4 GHz flux density measurements.
.Therefore it seems unlikely that extended emission is causing the
discrepancy between the two 1.4 GHz flux density measurements.
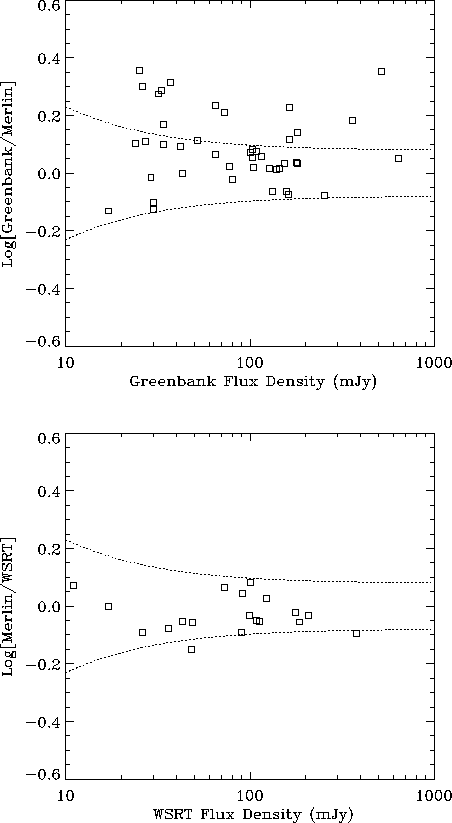 |
Figure 5: The logarithm of the ratio of the Greenbank/MERLIN 5 GHz (left) and the WSRT/MERLIN 5 GHz (right) measurements as function of flux density |
The Greenbank flux densities for the GPS sources in our sample are always equal or higher than the MERLIN and WSRT flux densities. This suggests that extended emission or confusion by background sources in the Greenbank measurements plays an important role. Indeed, four of the five sources with nearby components (see Fig. 4) differ in their 5 GHz Greenbank and MERLIN measurements by more than 20%. However, the flux densities of the nearby components are relatively low, and therefore variability is more likely to be the dominant factor. The absence of ratios <0.8 is probably caused by a selection effect. The Greenbank measurements are much older (1987) than all the other measurements. If a GPS source has monotonically increased in flux density between 1987 and the first half of this decade than the Greenbank flux density will be significantly lower than the 5 GHz WSRT and the MERLIN flux density measurements. However the chance that this source will appear in our sample is then very small, since the spectral index between WENSS and Greenbank is probably not inverted. Furthermore the Greenbank flux density would be too low with respect to the newer WSRT 1.4 GHz and the VLA 8.4 GHz measurements to be included in our sample as a GPS source. If a GPS source is monotonically decreasing with flux density between 1987 and the first half of this decade then there is only a problem if the peak frequency is greater than about 10 GHz, which could make both the Greenbank 5 GHz and the VLA 15 GHz measurement greater than the 8.4 GHz flux density measurement. Thus only sources with stable or decreasing flux densities are likely to be selected in our sample. Examples of GPS sources with decreasing flux densities are B0537+6444, B0552+6017, B0756+6647, B0830+5813 and B1538+5920.
Unlike the NVSS observations, the snapshot WSRT observations are not suitable
for mapping possible low level extended emission around the GPS sources,
due to the poor UV-coverage of the WSRT observations. The
NVSS images have been used to look for extended emission around our GPS
sources on scales <100''. Extended emission was detected in 5 of our
objects, namely B0544+5846, B1538+5920, B1620+6406, B1642+6701 and B1647+6225.
Their corresponding maps are shown in Fig. 4. It is not clear if
these additional sources are components associated with the GPS objects or
superimposed unrelated sources.
From the source density in the NVSS survey, we estimate that there is
a ![]() chance of finding a
radio source with a flux density of >5 mJy within a radius of 100''.
Hence in our sample of 47 sources, 3 GPS sources might be expected to have
unrelated sources within 100'', while 5 are found. This is not a
significant difference.
chance of finding a
radio source with a flux density of >5 mJy within a radius of 100''.
Hence in our sample of 47 sources, 3 GPS sources might be expected to have
unrelated sources within 100'', while 5 are found. This is not a
significant difference.
Copyright The European Southern Observatory (ESO)