V 465 Per was observed at the SNUO with a photometrics PM512 CCD camera
and Johnson V filter mounted on the the 61 cm Ritchey-Chrétien telescope.
The CCD chip has an area of ![]() pixels and a pixel size of
pixels and a pixel size of ![]() m. The size of the
field of view in the CCD image is
m. The size of the
field of view in the CCD image is ![]() (0.945 electrons pixel-1; Sung 1995) at the
f/7 Cassegrain focus of our telescope. We used the 4X gain factor of which the gain is 4.11
electrons ADU-1 and the readout noise is 6.2 electrons.
(0.945 electrons pixel-1; Sung 1995) at the
f/7 Cassegrain focus of our telescope. We used the 4X gain factor of which the gain is 4.11
electrons ADU-1 and the readout noise is 6.2 electrons.
The observations were carried out for thirteen nights (76.4 hours observation) from November 21, 1994
to January 17, 1995. The exposure time and the duty cycle were 35 s
and 80 s, respectively.
The photometric seeing (FWHM) was typically ![]() during the observing run.
Evening twilight flat field frames were obtained for each night to flatten the raw CCD frames.
Real-time aperture photometry was performed with the SNUCCD program (Kim et al. 1993), adopting
a somewhat large aperture size of 20 pixels.
The observational techniques and the methods of data reduction
are the same as Papers I and II.
during the observing run.
Evening twilight flat field frames were obtained for each night to flatten the raw CCD frames.
Real-time aperture photometry was performed with the SNUCCD program (Kim et al. 1993), adopting
a somewhat large aperture size of 20 pixels.
The observational techniques and the methods of data reduction
are the same as Papers I and II.

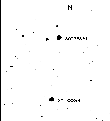
Figure 1: Observed CCD field (![]() )
near V 465 Per (=SAO 38891).
A comparison star (SAO 38894) and a faint check star
located at the east of the variable star were
monitored simultaneously
)
near V 465 Per (=SAO 38891).
A comparison star (SAO 38894) and a faint check star
located at the east of the variable star were
monitored simultaneously
![]()
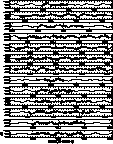
Figure 2: Power spectra of differential magnitudes for a faint check star.
It seems to be only noisy powers originated in the observation errors.
Four frequencies (f1, f2, f3 and f4) of V 465
per identified in this paper are also shown for comparison
An observed CCD field near V 465 Per (= SAO 38891) is shown in Fig. 1 (click here).
We used SAO 38894 (![]() ) as a comparison star considering its brightness.
A faint check star near (east) the variable star was also monitored. No
peculiarity of the comparison star was observed during the observing run
and the constancy of its brightness was confirmed by the power spectrum of
magnitude differences between the check and comparison stars (Fig. 2 (click here)).
Since the above three stars were observed simultaneously in the same CCD frame,
differential magnitudes could be obtained independently from atmospheric variations.
) as a comparison star considering its brightness.
A faint check star near (east) the variable star was also monitored. No
peculiarity of the comparison star was observed during the observing run
and the constancy of its brightness was confirmed by the power spectrum of
magnitude differences between the check and comparison stars (Fig. 2 (click here)).
Since the above three stars were observed simultaneously in the same CCD frame,
differential magnitudes could be obtained independently from atmospheric variations.

Figure 3: Light curves of V 465 Per. The points denote the actual data observed for
thirteen nights and the fitting lines represent the analytic light curves computed with four
frequencies detected in this study
Light curves of V 465 Per are shown in Fig. 3 (click here), where the points denote the differential magnitudes
observed for thirteen nights. The data were corrected for the atmospheric extinction
and normalized by subtracting the mean of differential magnitudes for each night
in order to correct the long-term instrumental drift.
These data are available in electronic form from the first author or from the WWW (World Wide Web)
addressed of http://www.boao.re.kr/![]() slkim/works.html.
The solid curves represent the analytic light curves computed with four frequencies
obtained in the present study.
slkim/works.html.
The solid curves represent the analytic light curves computed with four frequencies
obtained in the present study.