The mean relative position of the comet with respect to sun and earth during
the observational period on April 10, 1986, was r = 1.32 AU and ![]() AU, respectively; the values were computed from orbit parameters
published by Green (1985). The heliocentic radial velocity was
AU, respectively; the values were computed from orbit parameters
published by Green (1985). The heliocentic radial velocity was
![]() . The closest approach of the comet to the
Earth occured on April 11, 1986 (West 1988).
. The closest approach of the comet to the
Earth occured on April 11, 1986 (West 1988).
The observation geometry as projected on the celestial plane is
shown in Fig. 1 (click here). Superimposed upon a contour plot of the coma
of P/Halley this figure contains the projected directions from the cometary
nucleus towards north (N), east (E), and the sun (![]() ). The proper motion
(PM) of the comet was about
). The proper motion
(PM) of the comet was about ![]() . The position angle
(counted N-E-S-W) of the sun was equal to
. The position angle
(counted N-E-S-W) of the sun was equal to ![]() , and that of the
proper motion vector was
, and that of the
proper motion vector was ![]() . Further details of this figure will
be explained in Sect. 2.3 (click here).
. Further details of this figure will
be explained in Sect. 2.3 (click here).
The phase angle of P/Halley, i.e. the angle sun-comet-earth, had a value of
![]() . This caused an apparent shortening of the comet tail
in the projection on the celestial plane.
. This caused an apparent shortening of the comet tail
in the projection on the celestial plane.
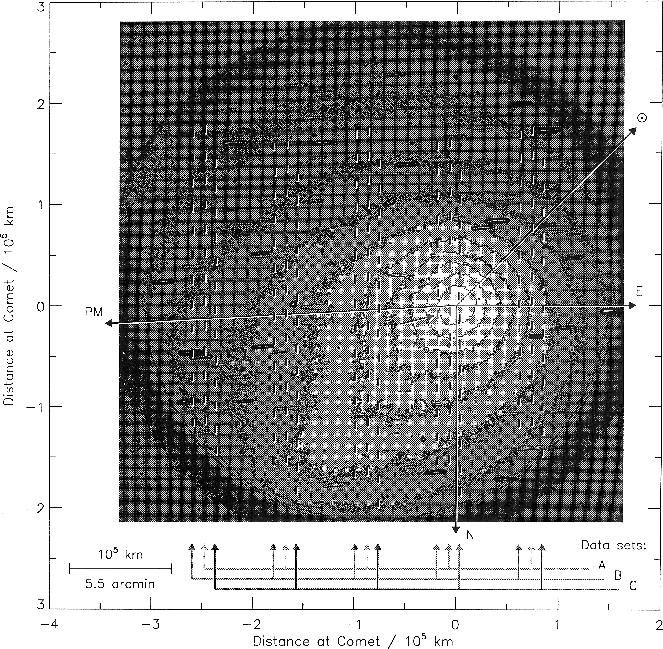
Figure 1: Coma of P/Halley in the light of ![]() with superimposed slit
positions of the three data sets, and projected directions
with superimposed slit
positions of the three data sets, and projected directions
The observations were performed at the ESO 1 m telescope using the focal reducer of the Observatory Hoher List (Geyer et al. 1979) and instrumental components provided by the Max-Planck-Institut für Aeronomie. The instrumentation has been described by Jockers et al. (1987).
After having passed the Cassegrain focus of the telescope the beam is
recollimated. Filters (imaging mode) or grating prisms (spectrographic mode)
are placed in the parallel beam. A camera lens with 50 mm aperture and 140
mm focal length creates a reduced image of the Cassegrain focus at the
detector. In imaging mode at the ESO 1 m telescope, the plate scale was
![]() and the field size about
and the field size about ![]() . In this mode an interference filter centered at 3690 Å
with half width (FWHM) of
. In this mode an interference filter centered at 3690 Å
with half width (FWHM) of ![]() was used which shows the
cometary coma predominantly in the light of
was used which shows the
cometary coma predominantly in the light of ![]() .
.
In spectrographic mode a slit plate consisting of 69 slits arranged in five
columns was employed in the Cassegrain focal plane as diaphragm to
simultaneously obtain spectra from 69 different parts of the coma of P/Halley.
The grating prism had 600 grooves per mm and was used in first order. An overlap
of individual spectra was avoided by an interlaced arrangement of the slits
combined with a slight tilt between the slit direction and the normal with
respect to the grating
dispersion. At the first order straight-through wavelength (3930 Å) the
reciprocal linear dispersion was about ![]() . The exact
value of dispersion depended on the positions of the slits relative to the
grating prism (Loewen 1970). The spectral resolution was about
4 Å. The focal reducer lens optics and a BG24 filter restricted the
effective wavelength range to the interval between approximately 3500 and
4500 Å.
. The exact
value of dispersion depended on the positions of the slits relative to the
grating prism (Loewen 1970). The spectral resolution was about
4 Å. The focal reducer lens optics and a BG24 filter restricted the
effective wavelength range to the interval between approximately 3500 and
4500 Å.
The detector consisted of a two stage proximity image intensifier with
bi-alkali cathode (Cromwell et al. 1985) and plates pressed
against its output window of 25 mm diameter. The advantage of the image
intensifier in comparison with a CCD camera was its better sensitivity in
the near-UV and blue spectral ranges where principal cometary emissions are
located. The main disadvantage of the intensifier was its large-scale
signal-induced background (Cromwell & Smith 1973). The
intensifier created halos surrounding the brightest areas and a fixed
pattern of small spots. All images were recorded on hypersensitized IIIa-F
plates of ![]() size. Inhomogeneities in the hypersensitation may be present but
probably are of minor influence. The weather conditions allowed measurements
of high photometric quality.
size. Inhomogeneities in the hypersensitation may be present but
probably are of minor influence. The weather conditions allowed measurements
of high photometric quality.
The aim of the observations was to obtain spectra of the comet from different
coma areas. In order to know the locations of the slits with respect to the
changing plasma tail, first a filter image of P/Halley was obtained in the
light of ![]() using an interference filter centered at 3690 Å with
100 Å full width at half maximum (FWHM).
This filter shows the plasma tail best,
because the contribution of dust continuum and neutral coma is reduced.
Then the interference filter was changed into a BG24 filter and the slit
plate was inserted to record the slit positions in double exposure technique
on the same plate. After that the focal reducer was used with the grating
prism and three multislit spectra were taken with different exposure times
in order to enlarge the dynamic range of measurable cometary intensities.
This cycle was repeated three times, i.e. altogether three data sets A,
B, and C, were recorded, each consisting of four plates. The plates are listed
in Table 1 (click here). Pictures of plates F171 and F172 were presented
by Jockers et al. (1987). During the cometary exposures the
telescope tracking was set to follow the motion of the comet.
using an interference filter centered at 3690 Å with
100 Å full width at half maximum (FWHM).
This filter shows the plasma tail best,
because the contribution of dust continuum and neutral coma is reduced.
Then the interference filter was changed into a BG24 filter and the slit
plate was inserted to record the slit positions in double exposure technique
on the same plate. After that the focal reducer was used with the grating
prism and three multislit spectra were taken with different exposure times
in order to enlarge the dynamic range of measurable cometary intensities.
This cycle was repeated three times, i.e. altogether three data sets A,
B, and C, were recorded, each consisting of four plates. The plates are listed
in Table 1 (click here). Pictures of plates F171 and F172 were presented
by Jockers et al. (1987). During the cometary exposures the
telescope tracking was set to follow the motion of the comet.
In addition a single-exposure direct image of P/Halley without slit marks was
recorded on plate F170. In Fig. 1 (click here) a contour plot of this image
is shown in logarithmic intensity scale without any background subtracted.
The head of P/Halley and the ![]() ion tail, pointing away from the sun,
are visible. In this figure the slit positions for the three data sets,
deduced from plates F161, F166, and F171, are represented by short vertical
lines. For each data set they are arranged in five columns.
The slits are aligned parallel to the
north-south direction and their projected size at the comet is about
ion tail, pointing away from the sun,
are visible. In this figure the slit positions for the three data sets,
deduced from plates F161, F166, and F171, are represented by short vertical
lines. For each data set they are arranged in five columns.
The slits are aligned parallel to the
north-south direction and their projected size at the comet is about
![]() . The covered field size is about
. The covered field size is about
![]() . The location of the
slit pattern is slightly shifted in the data sets A, B, and C. The reason
for this is either the bending within the instrument or tracking errors of
the telescope. In the data analysis we have assumed that the image of the
slits with respect to the comet taken at the beginning of the data set is
representative for the location during acquisition of the spectra. For data
set C this is proven by the additional exposure F175, on which the position
of the slits is identical to F171. Furthermore Fig. 1 (click here) shows
trailed background stars and the circular output window of the image
intensifier. In the upper part at the left side a large hot spot of the
intensifier is visible which appears on all plates.
. The location of the
slit pattern is slightly shifted in the data sets A, B, and C. The reason
for this is either the bending within the instrument or tracking errors of
the telescope. In the data analysis we have assumed that the image of the
slits with respect to the comet taken at the beginning of the data set is
representative for the location during acquisition of the spectra. For data
set C this is proven by the additional exposure F175, on which the position
of the slits is identical to F171. Furthermore Fig. 1 (click here) shows
trailed background stars and the circular output window of the image
intensifier. In the upper part at the left side a large hot spot of the
intensifier is visible which appears on all plates.
For absolute calibration a spectrum (F176) of the emission line nebula NGC 6302 (Aller et al. 1981) was recorded. The measured relative line intensities were compared to published absolute intensities, and the derived response function was used to calibrate the cometary spectra. Image F177 shows the location of the slit with respect to the nebula and indicates that the brightest area was missed by about 15 arcsec. CCD spectra of NGC 6302 were taken in July 1982 with the ESO 1.5 m telescope at the brightest part of the nebula and at the slit location indicated by plate F177. These data indicate that spectrum F176 represents well the brightest part of the nebula. In view of the uncertainty in telescope tracking and the small angular extent of the nebula we have assumed that the brightest part of the nebula was recorded in the plate spectrum. If this was not the case, our cometary column densities must be considered as upper limits. As we will see in Sect. 5.1 (click here) our values are indeed higher than the values found in the literature, but by not more than a factor of 2.