 |
Figure 7:
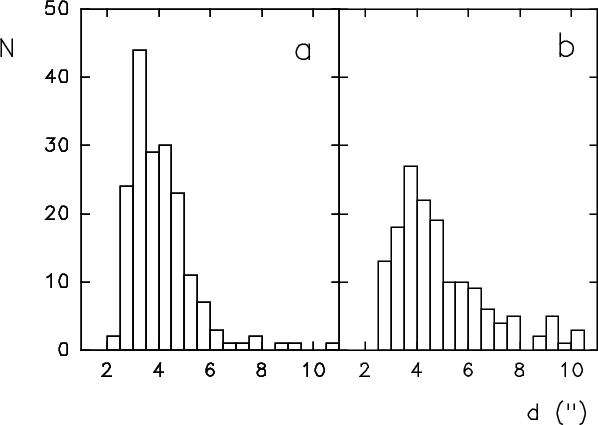
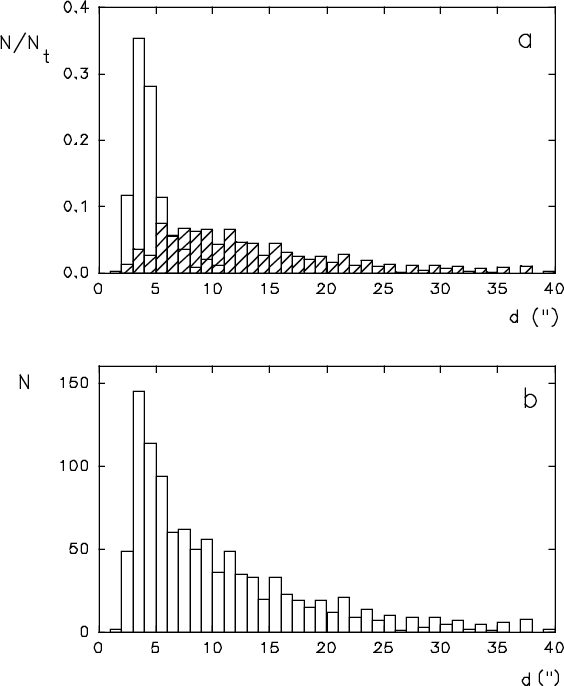
Size distributions of 748
|
Figure 7a presents distributions of sizes for 334 nebulae of types b and
d from Table 1 and 748 nebulae from the sample of Courtes et al. (1987).
We restrict ourselves to sizes
![]() ,
which is sufficient
for our study. Both distributions are normalized to the total number of
objects in each sample. Maxima of these distributions
are markedly different. The nebulae found with the visual inspection of
the images has a wide maximum in region of
,
which is sufficient
for our study. Both distributions are normalized to the total number of
objects in each sample. Maxima of these distributions
are markedly different. The nebulae found with the visual inspection of
the images has a wide maximum in region of
![]() .
It is
evident that its location is determined by the selection of incomplete
inclusion of nebulae smaller than
.
It is
evident that its location is determined by the selection of incomplete
inclusion of nebulae smaller than
![]() in size.
Our nebulae maximum falls at sizes
in size.
Our nebulae maximum falls at sizes
![]() ,
which
corresponds to 10-14 pc. Estimates of the most likely size of HII regions
in M33 are known from
,
which
corresponds to 10-14 pc. Estimates of the most likely size of HII regions
in M33 are known from
![]() (Sabbadin et al. 1980) to
(Sabbadin et al. 1980) to
![]() (Boulestex et al. 1974). The most likely size derived depends on a number
of factors, mainly on image scale (see review and discussion in
Sharov 1988). It is improbable that distribution of real nebulae sizes
in M33 should terminate at 10 pc. For instance, in the Galaxy, compact
HII regions of smaller size occur fairly often (Wink et al. 1982).
Therefore the position of the maximum in our sample is also
explained by the selection effect in isolating nebulae. The losses of our
nebulae caused by the selection originate at sizes smaller than
(Boulestex et al. 1974). The most likely size derived depends on a number
of factors, mainly on image scale (see review and discussion in
Sharov 1988). It is improbable that distribution of real nebulae sizes
in M33 should terminate at 10 pc. For instance, in the Galaxy, compact
HII regions of smaller size occur fairly often (Wink et al. 1982).
Therefore the position of the maximum in our sample is also
explained by the selection effect in isolating nebulae. The losses of our
nebulae caused by the selection originate at sizes smaller than
![]() .
.
In Fig. 7b a total distribution of sizes of nebulae from the two lists
is shown. It appears quite smooth and continuous. From comparison
of Figs. 7a and 7b it can be concluded that in the region of sizes
![]() many nebulae are missing in our sample; the
incompleteness of the list here is
many nebulae are missing in our sample; the
incompleteness of the list here is
![]() .
For nebulae with sizes greater than
.
For nebulae with sizes greater than
![]() (25 pc) the
incompleteness of our list sharply increases. This is probably due to
the fact that a single early star is incapable of ionizing
larger HII regions. Such regions are ionized by groups of
stars or OB associations, which were, naturally, disregarded
when compiling the catalogue by IFM. As it was
shown (Ivanov 1991), the size distribution of OB associations
in M33 fits well the distribution of HII regions from the
list of Courtes et al. (1987).
(25 pc) the
incompleteness of our list sharply increases. This is probably due to
the fact that a single early star is incapable of ionizing
larger HII regions. Such regions are ionized by groups of
stars or OB associations, which were, naturally, disregarded
when compiling the catalogue by IFM. As it was
shown (Ivanov 1991), the size distribution of OB associations
in M33 fits well the distribution of HII regions from the
list of Courtes et al. (1987).
In the list of Courtes et al. (1987) 23 bubbles are presented whose sizes range from 70 to 250 pc. Based on the character of distributions of b nebulae from these two samples it was suggested (see for more details Fabrika & Sholukhova 1997), that our bubbles of small sizes and the bubbles of Courtes et al. (1987) are of different physical nature, whereas the bubbles with sizes > 6'' may belong to the same population as these of Courtes et al. (1987).
Up to the sizes
![]() ,
the sample of Courtes
et al. (1987) chiefly contains diffuse and compact objects, and the
shaded histogram in Fig. 7a actually represents the distribution of
objects only of these types. The distribution of objects from both
lists looks compatible and supplement each other in Fig. 7. We
can suggest that, as different from bubbles, diffuse nebulae of the
two lists are likely to belong to the same population.
,
the sample of Courtes
et al. (1987) chiefly contains diffuse and compact objects, and the
shaded histogram in Fig. 7a actually represents the distribution of
objects only of these types. The distribution of objects from both
lists looks compatible and supplement each other in Fig. 7. We
can suggest that, as different from bubbles, diffuse nebulae of the
two lists are likely to belong to the same population.
It can be seen from Fig. 9 that with
growing size of the diffuse
nebulae their U-B index decreases (
![]() ).
The figure supports the assumption that size of such a nebula,
i.e. HII region, is determined by the star temperature.
However the mean colours of the diffuses (Table 2) are in agreement with
those calculated for an optically thick slab of hydrogen gas with temperature
).
The figure supports the assumption that size of such a nebula,
i.e. HII region, is determined by the star temperature.
However the mean colours of the diffuses (Table 2) are in agreement with
those calculated for an optically thick slab of hydrogen gas with temperature
![]() K (Kolesov 1996). Comparing the data in Fig. 9 with
the calculations one may conclude that with growing size of the diffuse
nebulae their gas excitation temperature (or optical thickness) drops.
It may also follow from the figure that with the growing size
the Balmer line emission becomes brighter (or the contribution
of the nebula spectrum to a total flux grows).
The relations for bubble nebulae in Fig. 9 are insignificant. It is not
improbable, however, that the bubbles get cooler and their gas
temperature drops as the size increases (or the F(
K (Kolesov 1996). Comparing the data in Fig. 9 with
the calculations one may conclude that with growing size of the diffuse
nebulae their gas excitation temperature (or optical thickness) drops.
It may also follow from the figure that with the growing size
the Balmer line emission becomes brighter (or the contribution
of the nebula spectrum to a total flux grows).
The relations for bubble nebulae in Fig. 9 are insignificant. It is not
improbable, however, that the bubbles get cooler and their gas
temperature drops as the size increases (or the F(
![]() )
flux increases,
Fig. 5) since U-B decreases, while B-V grows. The significance of the
relationships for the nebulae of type b allows this effect just to
be suspected.
)
flux increases,
Fig. 5) since U-B decreases, while B-V grows. The significance of the
relationships for the nebulae of type b allows this effect just to
be suspected.
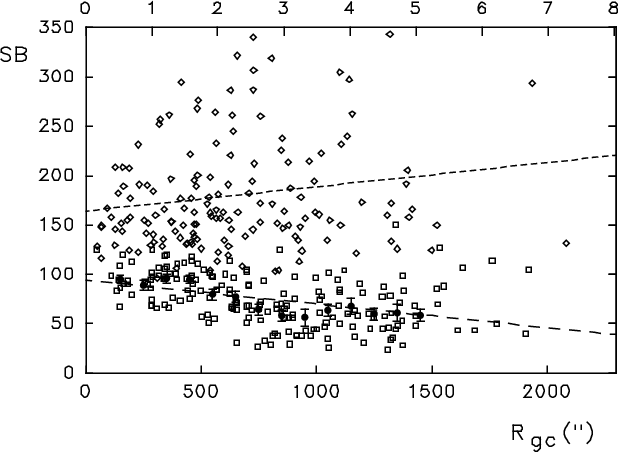
We present in Fig. 10 relationships between
![]() surface brightness
(SB) of b and d nebulae and their galactocentric distance. Besides the
apparent separation of the nebulae into two groups in SB(it was discussed above), the brightness of bubbles is
clearly seen to decrease with the distance from centre,
C
surface brightness
(SB) of b and d nebulae and their galactocentric distance. Besides the
apparent separation of the nebulae into two groups in SB(it was discussed above), the brightness of bubbles is
clearly seen to decrease with the distance from centre,
C
![]() .
The increasing brightness of
the diffuses is also noticeable, but this is not so significant.
The nebulae of d type in this figure show a considerable scatter.
One can see that the diffuse nebulae whose surface
brightness is not high (
.
The increasing brightness of
the diffuses is also noticeable, but this is not so significant.
The nebulae of d type in this figure show a considerable scatter.
One can see that the diffuse nebulae whose surface
brightness is not high (
![]() ), do not show SB to depend on
the distance, while in brighter objects SB is
likely to grow with distance. In other words, the bright
diffuse objects exhibit the dependence of SB on
), do not show SB to depend on
the distance, while in brighter objects SB is
likely to grow with distance. In other words, the bright
diffuse objects exhibit the dependence of SB on
![]() .
.
It is evident from geometrical considerations that with increasing
size of diffuse nebula its surface brightness rises, whereas
it diminishes (or remains approximately constant) in a case of a bubble.
The increase in SB of the bright diffuse nebulae with the galactic distance
in Fig. 10 is quite consistent with results
of Searle (1971), Smith (1975),
Shields & Searle (1978), where the
strengthening of ionizing radiation along the radius
of M33 was discussed. This was derived in
analysis of line intensity ratios [OIII]/
![]() and
and
![]() /[SII] with radius. The relationship for the nebulae
of type d in Fig. 10 agrees with the assumption that the average
temperature of hot stars grows with distance from the galactic
nucleus. These relationships could be also explained by a chemical
composition gradient, the more so that such a gradient has been
determined in M33 (Kwitter & Aller 1981).
/[SII] with radius. The relationship for the nebulae
of type d in Fig. 10 agrees with the assumption that the average
temperature of hot stars grows with distance from the galactic
nucleus. These relationships could be also explained by a chemical
composition gradient, the more so that such a gradient has been
determined in M33 (Kwitter & Aller 1981).
A value
![]() we obtained above
assumes
we obtained above
assumes
![]() line flux originating in nebula, while the
underlying continuum flux is of stellar origin. This value
is a direct function of the ratio of the star's luminosity beyond
Lyman limit to the luminosity in V band, i.e. the star's
temperature. In the diffuse nebulae
line flux originating in nebula, while the
underlying continuum flux is of stellar origin. This value
is a direct function of the ratio of the star's luminosity beyond
Lyman limit to the luminosity in V band, i.e. the star's
temperature. In the diffuse nebulae
![]() Å. From calculations of
Churchwell & Walmsley (1973) this corresponds to effective
spectral class of ionizing stars O9.5. The nebula size
(Stromgren radius) is defined, in turn, by the luminosity and
temperature of the star, as well as by a surrounding gas density.
Taking the mean electron density
Å. From calculations of
Churchwell & Walmsley (1973) this corresponds to effective
spectral class of ionizing stars O9.5. The nebula size
(Stromgren radius) is defined, in turn, by the luminosity and
temperature of the star, as well as by a surrounding gas density.
Taking the mean electron density
![]() and
using data of Prentice & Haar (1969) for B0 stars, find the HII region sizes have to be
from a few pc to tens of pc depending on luminosity class of
the star. These values agree with typical sizes of the d type
nebulae in our list.
and
using data of Prentice & Haar (1969) for B0 stars, find the HII region sizes have to be
from a few pc to tens of pc depending on luminosity class of
the star. These values agree with typical sizes of the d type
nebulae in our list.
The bubbles show inverse relationship between SB and
![]() .
Such behaviour is due to
the drop of interstellar gas pressure caused by the decrease of
gravitational potential with increasing distance from the centre.
The size of a bubble is defined by its internal energy and by the
pressure of surrounding gas. In the case of envelopes around WR
stars, the total energy of a bubble is the energy of gas ejected
during the time of WR stage. Accordingly, in the case of SN
remnant this is the kinetic energy of ejecta. With a possible
considerable dispersion of those values the decrease in pressure
with distance throughout the galaxy accounts for the relationship
in Fig. 10. This effect was noticed earlier by
Boulestex et al. (1974). They found that sizes of large,
.
Such behaviour is due to
the drop of interstellar gas pressure caused by the decrease of
gravitational potential with increasing distance from the centre.
The size of a bubble is defined by its internal energy and by the
pressure of surrounding gas. In the case of envelopes around WR
stars, the total energy of a bubble is the energy of gas ejected
during the time of WR stage. Accordingly, in the case of SN
remnant this is the kinetic energy of ejecta. With a possible
considerable dispersion of those values the decrease in pressure
with distance throughout the galaxy accounts for the relationship
in Fig. 10. This effect was noticed earlier by
Boulestex et al. (1974). They found that sizes of large,
![]() ,
bubbles grow with radial distance.
,
bubbles grow with radial distance.
One can readily see (Fig. 10) together with the average fall of SBof bubbles with the galactic radius, this relation itself is not monotonic.
There are two pronounced peaks near
![]() and
and
![]() .
In these distance intervals the bubbles
surface brightness rises as if the interstellar medium pressure
is maximum there. In order to emphasize this, we present the mean
values of SB in
100'' bins denoted by the filled symbols.
The deviations from the linear trend are considerable and amount to
no less than 3-4
.
In these distance intervals the bubbles
surface brightness rises as if the interstellar medium pressure
is maximum there. In order to emphasize this, we present the mean
values of SB in
100'' bins denoted by the filled symbols.
The deviations from the linear trend are considerable and amount to
no less than 3-4 ![]() in separate bins. These features are
consistent with those discussed above when analyzing Fig. 6, namely:
there are more emission stars and diffuse nebulae in about the same
distance regions (spiral arms?), but the number of bubbles is smaller there.
It can be seen in Fig. 10
that the latter have an enhanced surface brightness in these
particular distances, which may be connected with the
increase in interstellar gas pressure. Humphreys & Sandage (1980)
isolated up to 10 arms in the M33 disk. This is quite possible because of
non-uniform location of the arms as well as their different curvature
that the spiral arms density turns out to be
higher in some intervals. On the other hand the existence of ring
structures in M33 may well be assumed. There is a lot of
evidence (e.g. Mezger 1970) that such structures do exist in the
Galaxy.
in separate bins. These features are
consistent with those discussed above when analyzing Fig. 6, namely:
there are more emission stars and diffuse nebulae in about the same
distance regions (spiral arms?), but the number of bubbles is smaller there.
It can be seen in Fig. 10
that the latter have an enhanced surface brightness in these
particular distances, which may be connected with the
increase in interstellar gas pressure. Humphreys & Sandage (1980)
isolated up to 10 arms in the M33 disk. This is quite possible because of
non-uniform location of the arms as well as their different curvature
that the spiral arms density turns out to be
higher in some intervals. On the other hand the existence of ring
structures in M33 may well be assumed. There is a lot of
evidence (e.g. Mezger 1970) that such structures do exist in the
Galaxy.
We may conclude that the diffuse nebulae are HII regions with an exciting
star. These are chiefly situated in the central part of the galaxy, in the
regions of enhanced gas density. The sizes of these nebulae in
![]() are very sensitive to their central stars temperature. We
believe that the brightness and colours of these objects are mainly
defined by their stars. On the two-colour diagram (Fig. 4) they
follow to the sequence of stars. Hydrogen emission is likely to
predominate in their spectra, while nebular
lines are weak. The bubbles are probably composed of a high excitation gas, nebula lines
must predominate in their spectra. Their central stars contribution
to the total flux of these objects may be insignificant. By
their properties we identify these objects with envelopes round WR
stars and with supernova remnants.
are very sensitive to their central stars temperature. We
believe that the brightness and colours of these objects are mainly
defined by their stars. On the two-colour diagram (Fig. 4) they
follow to the sequence of stars. Hydrogen emission is likely to
predominate in their spectra, while nebular
lines are weak. The bubbles are probably composed of a high excitation gas, nebula lines
must predominate in their spectra. Their central stars contribution
to the total flux of these objects may be insignificant. By
their properties we identify these objects with envelopes round WR
stars and with supernova remnants.
Copyright The European Southern Observatory (ESO)