Table 1 lists the final D4000 measurements and the associated random errors. Some sample spectra, exhibiting a diversity in spectral types, metallicities and gravities, are displayed in Fig. 3, whereas in Fig. 4 we show the break behaviour with effective temperature for the whole sample. It is clear from these plots that temperature is the main parameter governing D4000. The effect of metallicity is clearly noticeable in panel 3(b) and by the position of globular cluster stars in Fig. 4. Also, some gravity dependences are also observed, especially between hot dwarf-giants and supergiants, and between cold dwarfs and giants.
The definition of the D4000 given in
Eq. (1) resembles that of a color. However, the peculiar
combination of ![]() and
and ![]() translates into the introduction of a
wavelength weighting of the flux (Eq. 3).
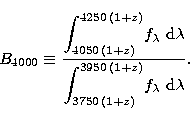
In order to facilitate the computation of the break, we have studied the effect
of a redefinition of the index, namely
translates into the introduction of a
wavelength weighting of the flux (Eq. 3).
In order to facilitate the computation of the break, we have studied the effect
of a redefinition of the index, namely
 |
(9) |
 |
(10) |
![\begin{figure}
\resizebox {140mm}{!}{\includegraphics[bb= 35 416 540 737,angle=0]{ds1707f5.eps}}\end{figure}](/articles/aas/full/1999/16/ds1707/img67.gif) |
Figure 5:
D4000 as a function of |
Copyright The European Southern Observatory (ESO)