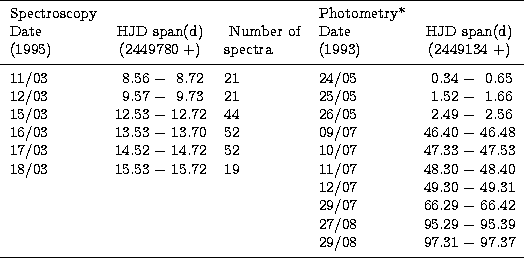
Our spectroscopic and photometric observations were performed at the 1.6 m (B&C) and 60 cm (Zeiss) telescopes of LNA, respectively.
Spectroscopic observations were obtained during six nights of March 1995 (over
a total time span of eight nights, see Table 1) with the coudé spectrograph
of the 1.6 m telescope. A EMI CCD camera (1152![]() 770 pixels) was used. Spectra
were taken with a grating of 1 800 l/mm (first inverse order) centered on the
HeI
770 pixels) was used. Spectra
were taken with a grating of 1 800 l/mm (first inverse order) centered on the
HeI ![]() 667.8 nm line. This arrangement yields a spectral resolution of
667.8 nm line. This arrangement yields a spectral resolution of
![]() and a wavelength range of
and a wavelength range of ![]() 89 Å. The
signal-to-noise
ratio was typically
89 Å. The
signal-to-noise
ratio was typically ![]() 250 for exposure times between 300 and 900 s.
The usual bias, flat field and Th-Ar comparison lamp spectra were taken during
each night. Observations were reduced with IRAF
250 for exposure times between 300 and 900 s.
The usual bias, flat field and Th-Ar comparison lamp spectra were taken during
each night. Observations were reduced with IRAF![]() using
standard techniques for two-dimensional CCD data.
using
standard techniques for two-dimensional CCD data.
Copyright The European Southern Observatory (ESO)