 |
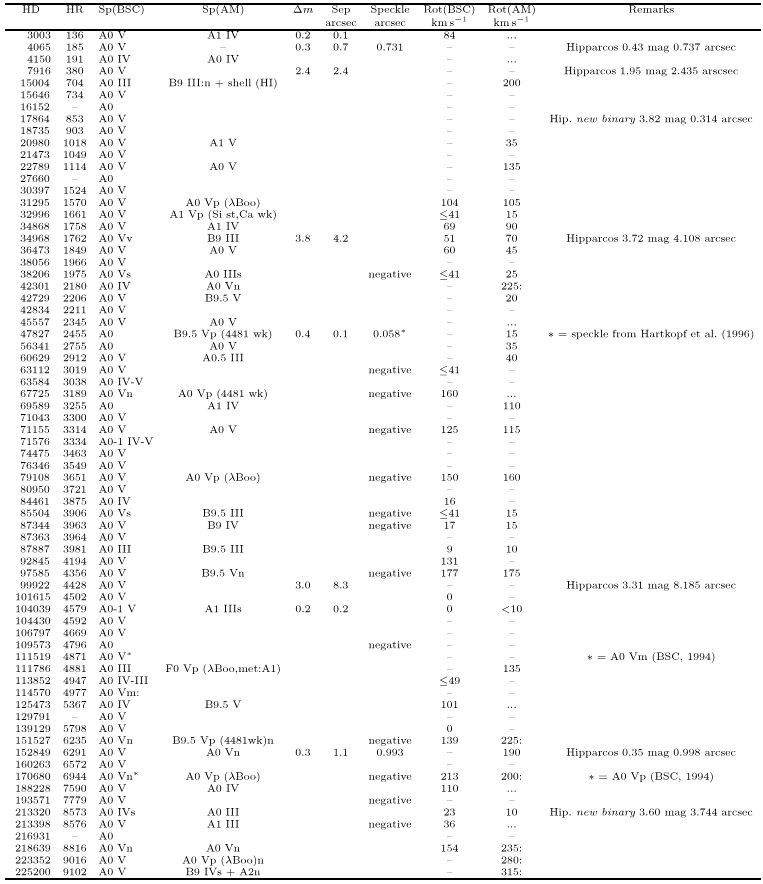
The basic data on the observed stars have been gathered in Table 1. Star identifications are given in Cols. 1 and 2, the spectral types from the BSC and from Abt and Morrell (1995) (hereafter AM) in Cols. 3 and 4.
The spectra were obtained with the ECHELEC spectrograph mounted at
the ESO 1.5 m telescope, in the period Jan. 89 - Jan. 95.
The linear dispersion is about 3.1 Å mm-1 in the chosen wavelength
range
4210-4500 Å. The slit width of 320 ![]() m corresponds to 1.52 arcsec
on the sky.
From unblended thorium lines, the FWHM of the instrumental profile was
measured; its value is 0.17 Å, in agreement with the size of the
entrance slit.
The original frame covers 11 orders of the echelle spectrum; only 9
of them have been retained and reduced, while the 2 truncated
orders on both sides of the
central wavelength have been discarded.
Flat field correction with a tungsten lamp and wavelength calibration
with a Th lamp have been made with classical procedures.
Great care was
devoted to remove instrumental defects which arose from time to time:
the most important ones were the two ghosts present as transversal bars
on the original frames in the 1991-1994 period; the method
is based on the accurate analysis of the intensity in the
inter-orders. The resolution is about 28000 and the S/N, highly
variable from the center to the edges of each order, covers the
range 50 to 200.
m corresponds to 1.52 arcsec
on the sky.
From unblended thorium lines, the FWHM of the instrumental profile was
measured; its value is 0.17 Å, in agreement with the size of the
entrance slit.
The original frame covers 11 orders of the echelle spectrum; only 9
of them have been retained and reduced, while the 2 truncated
orders on both sides of the
central wavelength have been discarded.
Flat field correction with a tungsten lamp and wavelength calibration
with a Th lamp have been made with classical procedures.
Great care was
devoted to remove instrumental defects which arose from time to time:
the most important ones were the two ghosts present as transversal bars
on the original frames in the 1991-1994 period; the method
is based on the accurate analysis of the intensity in the
inter-orders. The resolution is about 28000 and the S/N, highly
variable from the center to the edges of each order, covers the
range 50 to 200.
The analysis of the H![]() profile being one of the goals of the
present study, we had to produce a single spectrum by interconnecting
the echelle orders. A particular attention was given to the method
adopted for this connection.
The complete reduction procedure is
described in Burnage & Gerbaldi (1990, 1992).
The broad spectral domain covered by the H
profile being one of the goals of the
present study, we had to produce a single spectrum by interconnecting
the echelle orders. A particular attention was given to the method
adopted for this connection.
The complete reduction procedure is
described in Burnage & Gerbaldi (1990, 1992).
The broad spectral domain covered by the H![]() line in A0 dwarf
stars imposes to give a particular attention to the procedure adopted
to normalize the spectra.
The normalization is made by trial and error method; first the spectra
have been
normalized in the classical way by drawing the continuum through
the highest points of the spectrum and then overplotted on a template
synthetic spectrum. This allows to choose a number of
continuum points common to both; these points are used as references
in the final normalization procedure.
line in A0 dwarf
stars imposes to give a particular attention to the procedure adopted
to normalize the spectra.
The normalization is made by trial and error method; first the spectra
have been
normalized in the classical way by drawing the continuum through
the highest points of the spectrum and then overplotted on a template
synthetic spectrum. This allows to choose a number of
continuum points common to both; these points are used as references
in the final normalization procedure.
Since the observations span over 5 years, we have systematically observed four stars. The number of spectra obtained for each of them are: HD 15371: 19 spectra, HD 48915 (Sirius): 31 spectra, HD 149348: 13 spectra, HD 193924: 15 spectra. We checked the instrumental stability of the spectrograph and the consistency of the reduction procedures through the comparison of the spectra of these stars.
The reliability of the photometric calibration given by the flat field correction has been investigated through the measurement of the equivalent width (hereafter written EW) of lines selected over the observed spectral range; the number of lines measured in each spectrum was: 9 for HD 15371, 29 for HD 48915, 15 for HD 149348 and 6 for HD 193924. For each of these stars, we controlled that the distribution of the EWs of the selected lines is Gaussian; the mean value of the EW for each of these lines has been computed and the mean value of all the standard deviation is smaller than 0.005 Å.
The mechanical stability of the instrument has been tested through
the measurement of the position of the same set of lines in the same stars.
The final result is that the rms of line wavelengths corresponds
to 1 ![]() .
.
We verified also, using all the spectra of HD 48915, that the profile shape, after the normalization of the spectra, is conserved whatever the setup of the spectrograph has been.
These necessary tests allow us to use confidently the whole set of observations as an homogeneous sample of data in the following analysis.
Copyright The European Southern Observatory (ESO)