 |
Figure 2: Optically allowed: full, present; dotted, Bhatia & Mason (1986); dashed, Zhang & Sampson (1992) |
 |
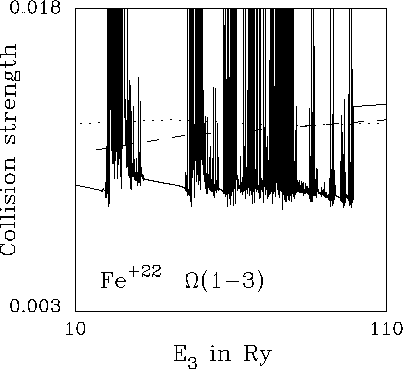 |
Figure 4: Optically allowed intersystem: full, present; dotted, Bhatia & Mason (1986); dashed, Zhang & Sampson (1992) |
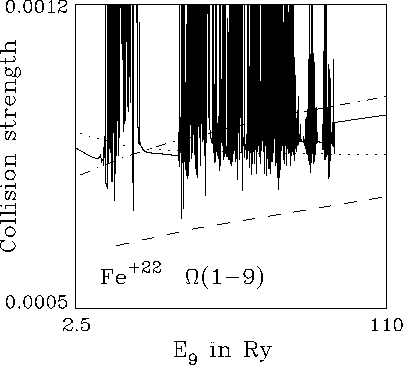 |
Figure 6: Optically forbidden (electric quadrupole): full, present; dotted, Bhatia & Mason (1986); dashed, Zhang & Sampson (1992); dot-dashed, Chen & Ong (1998) |
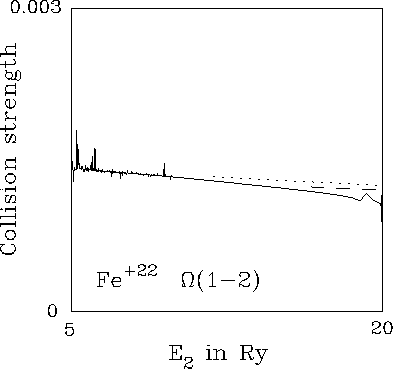 |
Figure 8: Optically forbidden intersystem: full, present; dotted, Bhatia & Mason (1986); dashed, Zhang & Sampson (1992) |
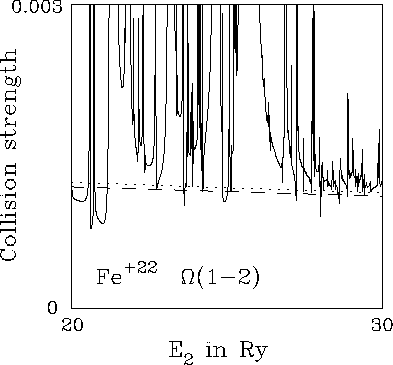 |
Figure 9: Optically forbidden intersystem: full, present; dotted, Bhatia & Mason (1986); dashed, Zhang & Sampson (1992) |
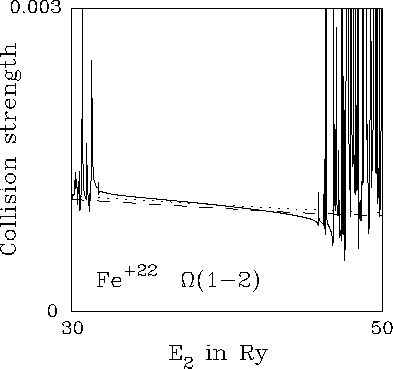 |
Figure 10: Optically forbidden intersystem: full, present; dotted, Bhatia & Mason (1986); dashed, Zhang & Sampson (1992) |
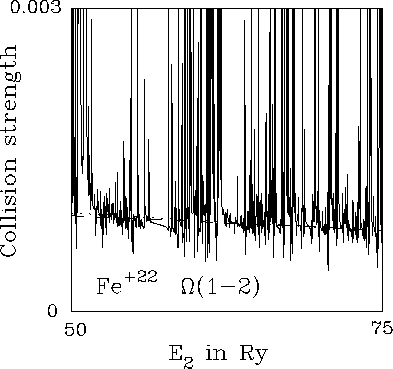 |
Figure 11: Optically forbidden intersystem: full, present; dotted, Bhatia & Mason (1986); dashed, Zhang & Sampson (1992) |
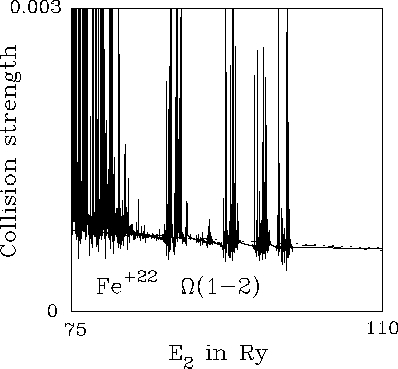 |
Figure 12: Optically forbidden intersystem: full, present; dotted, Bhatia & Mason (1986); dashed, Zhang & Sampson (1992) |
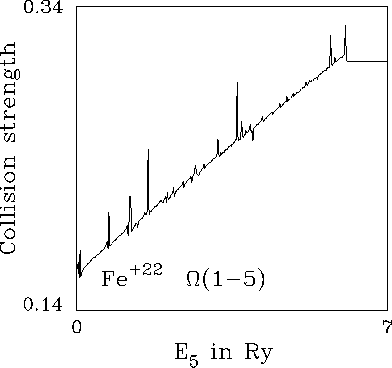
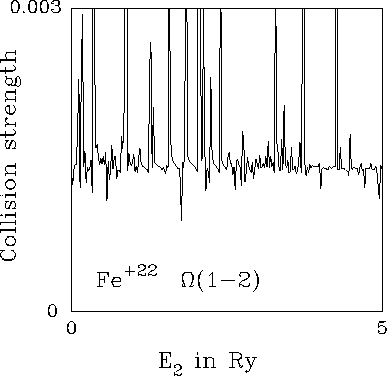
Figures 1 and 2 show ![]() . This is an optically allowed
transition meaning that the collision strength increases logarithmically
with energy as
. This is an optically allowed
transition meaning that the collision strength increases logarithmically
with energy as ![]() . In order to delineate the low energy
resonances in Fig. 1 we use a magnified energy scale there compared to
the one in Fig. 2.
. In order to delineate the low energy
resonances in Fig. 1 we use a magnified energy scale there compared to
the one in Fig. 2.
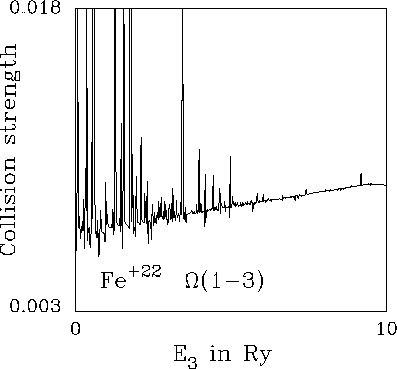
Figures 3 and 4 show ![]() . This is an intersystem transition
that behaves as though it were optically allowed owing to the breakdown of
LS coupling. For this to happen the initial and final levels must have
different parities and
. This is an intersystem transition
that behaves as though it were optically allowed owing to the breakdown of
LS coupling. For this to happen the initial and final levels must have
different parities and ![]() , subject to the condition that
, subject to the condition that
![]() .
.
Figures 5 and 6 show ![]() . This is a forbidden transition
in which neither the parity nor the spin change. The collision strength
for this type of transition tends to a finite limiting value as
. This is a forbidden transition
in which neither the parity nor the spin change. The collision strength
for this type of transition tends to a finite limiting value as
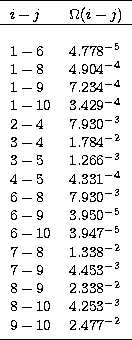
![]() . We have used the methods discussed
by Burgess et al. (1997) to calculate the Born limits for all
such transitions between levels whose index does not exceed 10
(see Table 8).
. We have used the methods discussed
by Burgess et al. (1997) to calculate the Born limits for all
such transitions between levels whose index does not exceed 10
(see Table 8).
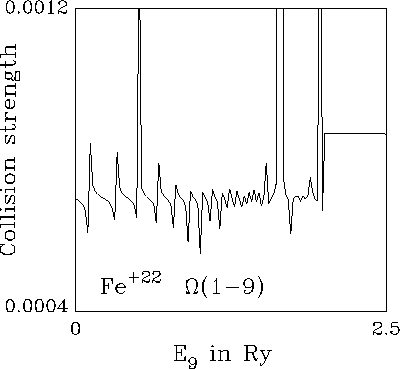
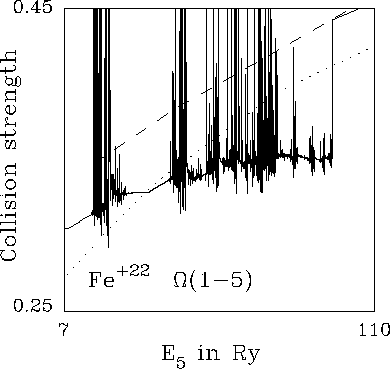
Figures 7 to 12 show ![]() . This is a forbidden intersystem
transition for which the collision strength normally falls off like
Ej-2 in the high energy limit.
. This is a forbidden intersystem
transition for which the collision strength normally falls off like
Ej-2 in the high energy limit.
It is well known that when a new threshold is crossed the collision strength
for a transition involving two lower levels will in general decrease, or
sometimes increase, so that the collision strength in question behaves like a
step function. This is explained by the influence of newly opened channels
which cause a redistribution of the total electron flux to occur.
The other thing to notice is the change in slope that occurs at the passage
from the "low'' to the ``intermediate'' energy region. This may be the result
of having calculated fewer partial waves in the "low'' energy region where we
maintained ![]() . We did however carry out a top-up procedure in order
to account for the higher partial waves.
. We did however carry out a top-up procedure in order
to account for the higher partial waves.
Copyright The European Southern Observatory (ESO)