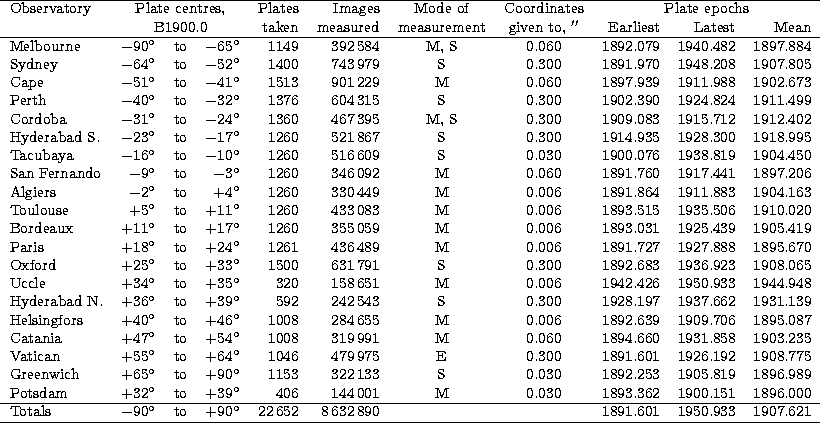
The Astrographic Catalogue provides rectangular coordinates as measured on the plate and
magnitude estimates of about 8.6 million star images. The limiting magnitude
of AC is roughly ![]() mag, though some zones give coordinates of stars
as faint as 13 mag. The basic information on the zonal catalogues
comprising the AC is provided in Table 1. It should be noted
that by chance the plates centred at
mag, though some zones give coordinates of stars
as faint as 13 mag. The basic information on the zonal catalogues
comprising the AC is provided in Table 1. It should be noted
that by chance the plates centred at ![]() were taken and measured
twice, by the Bordeaux and Toulouse observatories. The Hyderabad Observatory
was responsible for two zones. The Potsdam Observatory, originally
responsible for the zone
were taken and measured
twice, by the Bordeaux and Toulouse observatories. The Hyderabad Observatory
was responsible for two zones. The Potsdam Observatory, originally
responsible for the zone ![]() to
to ![]() , had stopped the work soon
after the First World War. Only about 30 per cent of the original plates
taken and measured at Potsdam were published. Later on, this zone was
reobserved at Oxford, Hyderabad and Uccle.
, had stopped the work soon
after the First World War. Only about 30 per cent of the original plates
taken and measured at Potsdam were published. Later on, this zone was
reobserved at Oxford, Hyderabad and Uccle.
Primary coordinate system on the AC plates was realized by the réseau - a silvered glass plate with a quadratic net of fine lines at 5 mm spacing, which was copied on every plate. The measurements of the positions of star images were made with respect to the photographic images of the réseau lines. A secondary coordinate system was realized by a micrometer or a cross of scales in the eyepiece of the measuring microscope used to measure image coordinates relative to réseau lines. The mode of measurement employed by the individual observatories is given in Table 1; S means an eyepiece scale, M a micrometer screw, and E an eyepiece grid, a special measuring technique used by the Vatican Observatory only.
Brightness measures were derived by a number of methods: by measuring the image diameter, by matching the image with standard ones or by eye estimation (Gureeva 1992). The diversity of the AC brightness measures substantially impedes both their reduction to a modern magnitude system and the removal of the magnitude equation present in the measured coordinates. The worst cases in this sense are the Sydney, Cape and Perth zones due to the two distinct estimation methods used for every plate, one for the bright stars and another one for the faint stars. Consequently, the analysis of the magnitude equation in the data of these observatories was the most complicated of all. This situation could only be improved by using modern magnitudes for the stars.
Furthermore, an analysis of the last digit of the published coordinates
suggests that its distribution is far from uniform. In the Tacubaya zone, for
example, only the figures 0, 2, 5, 7 or 0, 3, 5, 8 occur as the last digit,
and on any given plate only one of these two sets is present. Other figures
are rare, probably being misprints. Moreover, the last digit in those zones
where it corresponds to 0![]() 3 was found to be dominated by even numbers
(or 0 and 5, in case of the Vatican zone). A similar effect for the Hyderabad
zone was previously reported by
(Eichhorn & Gatewood 1966).
In such cases the digitization error is at least two times larger than the
0
3 was found to be dominated by even numbers
(or 0 and 5, in case of the Vatican zone). A similar effect for the Hyderabad
zone was previously reported by
(Eichhorn & Gatewood 1966).
In such cases the digitization error is at least two times larger than the
0![]() 09 value predicted from a uniform distribution of the last decimal
place, reaching as much as 0
09 value predicted from a uniform distribution of the last decimal
place, reaching as much as 0![]() 43 in the case of the Vatican zone. Thus
for at least half of all AC measurements (i.e. the zones where the
measurements are given to 0
43 in the case of the Vatican zone. Thus
for at least half of all AC measurements (i.e. the zones where the
measurements are given to 0![]() 3) the accuracy of the published
coordinates is defined by the digitization error rather than by the
measurement accuracy. Obviously, a remeasurement of zones like Vatican or
Tacubaya would nearly double the precision.
3) the accuracy of the published
coordinates is defined by the digitization error rather than by the
measurement accuracy. Obviously, a remeasurement of zones like Vatican or
Tacubaya would nearly double the precision.
Verification of the keypunched AC data included manual and automated procedures which assured that the data comply to the formats and record sequencing used in the published volumes, that all the fields are present and all the exceptions (incomplete or uncertain data) are marked with special flags. A substantial number of keypunching errors and 5-10 times more frequent unreported misprints were detected and corrected on the basis of an identification of the AC data with the HST Guide Star Catalogue (GSC, Lasker et al. 1990; Russell et al. 1990; Jenkner et al. 1990). The final error rate of the machine-readable AC, i.e. of keypunching errors and misprints missing in the published errata lists and not found from AC-GSC matching, is estimated to be less than 0.1%.
The Tycho Catalogue is based on the observations with the star mapper on board the ESA Hipparcos astrometric satellite. A detailed description of the Tycho observational campaign, data processing and production of the catalogue can be found in the printed introduction (ESA 1997, Vol. 4).
The Tycho Catalogue provides positions at mean epoch J1991.25, proper motions,
parallaxes and two-colour photometry (in ![]() and
and ![]() bands) of
1052031 stars brighter than
bands) of
1052031 stars brighter than ![]() mag. The Tycho astrometric data is
referred to the ICRS system. The median standard error for stars at the
median magnitude
mag. The Tycho astrometric data is
referred to the ICRS system. The median standard error for stars at the
median magnitude ![]() mag and colour index
mag and colour index ![]() mag is estimated
as 25 mas in position and 0.06 mag in photometry. Standard errors of Tycho
astrometry and photometry as a function of
mag is estimated
as 25 mas in position and 0.06 mag in photometry. Standard errors of Tycho
astrometry and photometry as a function of ![]() magnitude are shown in
Fig. 1. The catalogue is more than 99 per cent complete down
to
magnitude are shown in
Fig. 1. The catalogue is more than 99 per cent complete down
to ![]() mag, the incompleteness basically occurring in dense fields.
mag, the incompleteness basically occurring in dense fields.
| Figure 1:
Astrometric (left) and photometric (right) accuracy of the Tycho Catalogue, as
a function of |
Copyright The European Southern Observatory (ESO)