The effectiveness of HCO+ and HCN as outflow indicators is demonstrated
in Fig. 18 where we have plotted the FWZI of these lines against the
corresponding widths for CO taken from Table 2. Also shown
is a comparison between the FWZIs of HCN and HCO+ (bottom panel).
One sees that in
most sources HCO+ and HCN, which preferentially sample high density gas,
have higher FWZI than CO. One should be clear that this is partially an
artifact. The CO data taken from the literature have in general
been averaged
over larger beams than those (![]() 25
25![]() ) used for HCN and HCO+.
Thus, they sample gas farther and at lower velocity from the IRAS source.
Moreover, the FWZI used in this comparison is a quantity which depends on
S/N and hence is not necessarily a good measure of source characteristics.
Nevertheless, the line widths measured in HCO+, HCN are extremely high and
show that a non-negligible fraction of dense gas is being accelerated
to velocities above 50 km s-1. It is interesting to note also that there is no
clear correlation between the FWZI measured in HCO+ and HCN, and bolometric
luminosity (see second panel of Fig. 18).
) used for HCN and HCO+.
Thus, they sample gas farther and at lower velocity from the IRAS source.
Moreover, the FWZI used in this comparison is a quantity which depends on
S/N and hence is not necessarily a good measure of source characteristics.
Nevertheless, the line widths measured in HCO+, HCN are extremely high and
show that a non-negligible fraction of dense gas is being accelerated
to velocities above 50 km s-1. It is interesting to note also that there is no
clear correlation between the FWZI measured in HCO+ and HCN, and bolometric
luminosity (see second panel of Fig. 18).
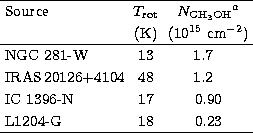
 a Detected only towards H2O maser position. |
We do however find a correlation between the intensity ratio of the
HCN(1-0) and HCO+(1-0) lines and the dust temperature as measured by the
ratio of 60 ![]() m and 12
m and 12 ![]() m IRAS fluxes (see Fig. 19 top).
We note here
that this flux ratio sometimes is found to be less a measure of temperature
than a measure of the prevalence of small grains excited by ultra-violet
photons and out of thermal equilibrium. We do not know whether that is the
case for the sources in our sample. However, we clearly see in
Fig. 19 top,
tendency for larger I(HCO+)/I(HCN) and hence presumably a larger
[HCO+]/[HCN] abundance ratio in sources with lower apparent dust
temperature (higher 60/12 flux ratio). The correlation is not of great
statistical significance, but seems to us worthy of verification with a
larger sample of objects. We note moreover that there is no clear
correlation with bolometric luminosity
(Fig. 19 bottom) but there is a slight correlation
(Fig. 19 middle) when one plots I(HCO+)/I(HCN) against
I(CH3CN)/
m IRAS fluxes (see Fig. 19 top).
We note here
that this flux ratio sometimes is found to be less a measure of temperature
than a measure of the prevalence of small grains excited by ultra-violet
photons and out of thermal equilibrium. We do not know whether that is the
case for the sources in our sample. However, we clearly see in
Fig. 19 top,
tendency for larger I(HCO+)/I(HCN) and hence presumably a larger
[HCO+]/[HCN] abundance ratio in sources with lower apparent dust
temperature (higher 60/12 flux ratio). The correlation is not of great
statistical significance, but seems to us worthy of verification with a
larger sample of objects. We note moreover that there is no clear
correlation with bolometric luminosity
(Fig. 19 bottom) but there is a slight correlation
(Fig. 19 middle) when one plots I(HCO+)/I(HCN) against
I(CH3CN)/![]() . The motivation for considering the latter
quantity is that it may be a measure of the relative importance of a
possible disk in these sources (assuming that the methyl cyanide emission in
some sense measures the disk emission). Here one sees a slight fall-off in
the HCO+ to HCN intensity ratio with increasing relative importance of the
methyl cyanide emission. Methyl cyanide seems to appear preferentially in
high temperature regions and hence it is possible that Fig. 19 top
and middle both are showing a correlation between high dust temperature and high
[HCN]/[HCO+] abundance ratio (or alternatively between the fraction of
"very small grains'' and the [HCN]/[HCO+] abundance ratio).
. The motivation for considering the latter
quantity is that it may be a measure of the relative importance of a
possible disk in these sources (assuming that the methyl cyanide emission in
some sense measures the disk emission). Here one sees a slight fall-off in
the HCO+ to HCN intensity ratio with increasing relative importance of the
methyl cyanide emission. Methyl cyanide seems to appear preferentially in
high temperature regions and hence it is possible that Fig. 19 top
and middle both are showing a correlation between high dust temperature and high
[HCN]/[HCO+] abundance ratio (or alternatively between the fraction of
"very small grains'' and the [HCN]/[HCO+] abundance ratio).
 a Source averaged, assuming the deconvolved CH3OH angular diameters given in Table 11. |
Copyright The European Southern Observatory (ESO)
