NGC 281-W has been recently studied by Henning et al. (1994) as well
as by Megeath & Wilson (1997), who have made detailed ![]() (2-1),
(2-1),
![]() (1-0), and C34S(3-2) maps of the clump studied by us, using the
IRAM 30-m telescope.
Our maps in the C34S(3-2) line are very similar to those obtained by
Megeath and Wilson in the same transition, although our map is just
sufficient to cover the C34S clump. From their
(1-0), and C34S(3-2) maps of the clump studied by us, using the
IRAM 30-m telescope.
Our maps in the C34S(3-2) line are very similar to those obtained by
Megeath and Wilson in the same transition, although our map is just
sufficient to cover the C34S clump. From their ![]() measurements, Megeath
and Wilson derive a clump mass of at least 210
measurements, Megeath
and Wilson derive a clump mass of at least 210 ![]() and an H2 column
density of 5 1022 cm-2. Henning et al. (1994) detected a
1.3 mm continuum source coincident with the IRAS source. They concluded that
the main contributor to this was a compact component of temperature 45 K and
angular size
and an H2 column
density of 5 1022 cm-2. Henning et al. (1994) detected a
1.3 mm continuum source coincident with the IRAS source. They concluded that
the main contributor to this was a compact component of temperature 45 K and
angular size ![]() . They estimated the peak H2 column density
to be 2 1023 cm-2 or 4 times larger than the value from
. They estimated the peak H2 column density
to be 2 1023 cm-2 or 4 times larger than the value from ![]() . This
does not agree with our beam averaged estimate based upon 13CO of
2 1022 cm-2, obtained assuming a 13CO abundance relative to
H2 of 1.1 10-6 and a temperature of 29 K as done by
Megeath & Wilson
(1997); note that the latter is consistent with the
. This
does not agree with our beam averaged estimate based upon 13CO of
2 1022 cm-2, obtained assuming a 13CO abundance relative to
H2 of 1.1 10-6 and a temperature of 29 K as done by
Megeath & Wilson
(1997); note that the latter is consistent with the ![]() of
13CO(2-1) (see Table 7). The column density from 13CO agrees
instead with the value derived by Megeath and Wilson from
of
13CO(2-1) (see Table 7). The column density from 13CO agrees
instead with the value derived by Megeath and Wilson from ![]() . One can
also estimate the column density from C34S, assuming spherical
symmetry and calculating the H2 volume density with the LVG program
mentioned in Sect. 4.5. This gives an H2 density of
5 105-1 106 cm-3, which implies a source averaged H2 column density
of (5-9) 1023 cm-2, where we have used a distance of 3.1 kpc for
the sake of comparison with the results of Megeath and Wilson. This value
compares well with that derived from the 1.3 mm continuum, which suggests
that C34S is indeed confined to the densest core associated with the
H2O maser and the FIR source seen by IRAS.
. One can
also estimate the column density from C34S, assuming spherical
symmetry and calculating the H2 volume density with the LVG program
mentioned in Sect. 4.5. This gives an H2 density of
5 105-1 106 cm-3, which implies a source averaged H2 column density
of (5-9) 1023 cm-2, where we have used a distance of 3.1 kpc for
the sake of comparison with the results of Megeath and Wilson. This value
compares well with that derived from the 1.3 mm continuum, which suggests
that C34S is indeed confined to the densest core associated with the
H2O maser and the FIR source seen by IRAS.
Henning et al. (1994) also mapped the source in CO(3-2) and found
evidence of an E-W offset between the peaks of blue and red shifted
emission (their Fig. 5). Snell et al. (1990) had previously detected
the outflow in CO(1-0) using the FCRAO system and found no clear evidence
for bipolarity. They derived an age of 2 105 yrs and a swept up mass of
11 ![]() for the flow. Our data do not help much to clarify the situation.
From Fig. 1a one sees that the line profiles towards NGC 281-W
are quite complex: while the CS and 13CO lines peak at the bulk velocity
given by C34S, the HCO+ and HCN lines peak at lower velocities than C34S.
Moreover, another component is clearly visible in the red wing of the 13CO,
HCO+, and CS transitions at
for the flow. Our data do not help much to clarify the situation.
From Fig. 1a one sees that the line profiles towards NGC 281-W
are quite complex: while the CS and 13CO lines peak at the bulk velocity
given by C34S, the HCO+ and HCN lines peak at lower velocities than C34S.
Moreover, another component is clearly visible in the red wing of the 13CO,
HCO+, and CS transitions at ![]() km s-1. Finally, broad line wings are
evident even in the C34S(3-2) line. Notwithstanding such a complexity of the
line profile, the spatial distribution of the gas at different velocities
looks quite the same, as the emission arises mostly from a region surrounding
the H2O masers. The sole exception is given by the gas associated with the
line wings, namely from -42.0 to -36 km s-1 and from -26 to -20 km s-1,
which seem to trace a bipolar outflow approximately centred on the H2O
maser and extending in the NE-SW direction. This is shown in
Fig. 12 for the HCO+(1-0) line. In conclusion, it is quite
difficult to decouple the different components which overlap in space
and - at least in part - in velocity: high angular resolution images might
help to identify the main centres of activity in the region and to describe
their interaction with the surrounding environment.
km s-1. Finally, broad line wings are
evident even in the C34S(3-2) line. Notwithstanding such a complexity of the
line profile, the spatial distribution of the gas at different velocities
looks quite the same, as the emission arises mostly from a region surrounding
the H2O masers. The sole exception is given by the gas associated with the
line wings, namely from -42.0 to -36 km s-1 and from -26 to -20 km s-1,
which seem to trace a bipolar outflow approximately centred on the H2O
maser and extending in the NE-SW direction. This is shown in
Fig. 12 for the HCO+(1-0) line. In conclusion, it is quite
difficult to decouple the different components which overlap in space
and - at least in part - in velocity: high angular resolution images might
help to identify the main centres of activity in the region and to describe
their interaction with the surrounding environment.
 |
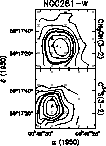
Figure 6:
Maps towards NGC 281-W of the integrated bulk emission in the
CH3OH(3-2) (top panel) and C34S(3-2) (bottom) transitions. Thick contours
correspond to 50% of the maximum in each map. The HPBW is |
In conclusion, one can speculate that in comparison with the "quiescent'' southern clump, the northern clump is in a more advanced phase of the star formation process, characterised by various signposts of activity such as the H2O masers and a small scale molecular outflow.
 |
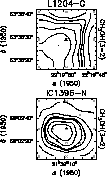
Figure 7:
Maps towards IC 1396-N and L1204-G of the integrated bulk emission
in the CH3OH(3-2) transitions. Thick contours
correspond to 50% of the maximum in each map. The HPBW is |
 |
Figure 8:
Same as Fig. 7 for the C34S(3-2) line towards
AFGL5142, S233, S235B, MONR2, NGC 2264-C, and IRAS23151+5912.
Thick contours
correspond to 50% of the maximum in each map. The HPBW is |
The spectra of Fig. 1c clearly indicate two velocity components, corresponding to the approximate velocity ranges from -17 to -13.5 km s-1 and from -20.5 to -17 km s-1. In Fig. 15 we show the maps of the CS(3-2) line emission integrated in these velocity intervals: two molecular clumps are evident, one at the H2O maser position, the other offset to the south-west. The same pattern is seen in the other transitions, with the sole exception of C34S, which traces only the H2O maser clump, as is evident from Fig. 8: this proves that the latter clump is denser than the other, consistent with the idea that star formation is going on in it.
The C34S(2-1), (3-2), (5-4) and 13CO(2-1) observations around
the highly variable H2O maser located between the S235 A and B optical
nebulosities, together with near infrared broad band (J, H and K) and narrow
band (H2 S(1) 1![]() 0 and Br
0 and Br![]() ) images were discussed in
Felli et al. (1997).
) images were discussed in
Felli et al. (1997).
A highly obscured stellar cluster is present between the thermal radio components S235 A and B in the near IR observations. The colour-colour analysis shows that the cluster contains many sources with infrared excess, most probably YSOs in an early evolutionary stage.
The driving source of the H2O maser does not appear to be either the YSO inside S235 A or S235 B, but is identified with a faint near infrared member of the cluster, with a large (H-K) colour excess, located near the position of the maser. This identification is further supported by the coincidence of the maser and the near IR source with the centre of the high density and hot compact molecular core observed in C34S and 13CO. The lack of radio continuum emission from the maser/near IR source suggests that the YSO powering the maser and responsible for the near IR emission must be in a very early evolutionary stage, highly obscured even at K band and strongly self-absorbed in the radio continuum, in any case much younger than S235 A and S235 B. S235 A and S235 B lie on the sides of the molecular core, suggesting that star formation in the complex is not coeval but proceeds from the outside towards the core of the molecular cloud.
As far as the CO outflow reported by Nakano & Yoshida (1986), the blue-shifted lobe from -24 km s-1 to -20 km s-1 can be seen also in the 13CO(2-1) data (see Fig. 4 of Felli et al. 1997) and is located between the H2O maser and S235 B. However, the red-shifted lobe observed in 12CO from -13 to -6 km s-1 (which is also weaker in Nakano & Yoshida 1986) was not detected in our data. The red wing of the 12CO profile may be affected by a superposition of different velocity components south of S235 B and has been questioned by Snell et al. (1990) and by Nakano & Yoshida (1986) themselves. Consequently, the earlier suggestion that S235 B was the source of the outflow is questionable and the possibility that the blue outflow comes from the H2O maser must be retained as a plausible alternative.
 |
An extensive molecular and IR study of the source was presented by Schreyer
et al. (1997), who mapped a much larger region than in our study. They
observed many different transitions, of which only the CS(3-2) and
C34S(3-2) lines are in common with us: for these, our results are consistent
with those of Schreyer et al. (1997). In particular, the emission
peaks at the position of the H2O masers rather than at the IR source IRS1.
Moreover, the secondary clump identified by Schreyer et al. to the south-east
of IRS1 can be partially seen also in our C34S(3-2) map of
Fig. 8, although at the very edge of it. However, the existence
of this clump at a velocity of ![]() 6.2 km s-1 is clearly demonstrated by the
13CO and HCN line profiles of Fig. 1h. Unfortunately, we cannot
confirm the molecular outflows seen by Schreyer et al. because for this
source we do not have maps in CS and HCO+, and 13CO and HCN are not
suitable for investigating the line wings. In fact, 13CO arises from a much
larger region than that mapped by us, while study of HCN emission is
complicated by the hyperfine structure of the line.
6.2 km s-1 is clearly demonstrated by the
13CO and HCN line profiles of Fig. 1h. Unfortunately, we cannot
confirm the molecular outflows seen by Schreyer et al. because for this
source we do not have maps in CS and HCO+, and 13CO and HCN are not
suitable for investigating the line wings. In fact, 13CO arises from a much
larger region than that mapped by us, while study of HCN emission is
complicated by the hyperfine structure of the line.
Our Pico Veleta observations as well as Plateau de Bure interferometer (PdBI) maps of the molecular gas and near infrared images of the same region, were presented in Cesaroni et al. (1997a).
All lines peak at ![]() km s-1 and the lower density tracers like 13CO or
HCO+ present broad wings extending up to
km s-1 and the lower density tracers like 13CO or
HCO+ present broad wings extending up to ![]() km s-1 from the peak.
Even the higher density tracer C34S, despite the much poorer S/N,
shows strong wings, although only up to
km s-1 from the peak.
Even the higher density tracer C34S, despite the much poorer S/N,
shows strong wings, although only up to ![]() km s-1 from the peak.
On this basis, five velocity ranges were defined:
km s-1 from the peak.
On this basis, five velocity ranges were defined:
The bulk emission is best studied through the high density tracers
such as the CH3OH(3-2), CH3CN(8-7), and C34S(3-2)
transitions.
In all cases the emission originates from the same
region with size ![]() ,
centred on the H2O maser spots: this is a clear indication of the
existence of a molecular clump in which the IRAS source and the H2O masers
are embedded.
,
centred on the H2O maser spots: this is a clear indication of the
existence of a molecular clump in which the IRAS source and the H2O masers
are embedded.
In order to map the line wings, one has to use the lines with the best S/N, such as CS(3-2) and HCO+(1-0) (see Fig. 4 of Cesaroni et al. 1997a). The outer wings seem to trace a NW-SE velocity shift, with the blue- and red-shifted emission coming respectively from NW and SE. The surprising result is that the blue- and red-shifted emission in the inner wings shows an orientation completely reversed with respect to the NW-SE axis above: although the direction is the same, the velocity increases from SE to NW.
Including the interferometric observations made with the PdBI, the main results are the following:
 |
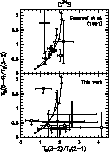
Figure 10:
Plots of the line brightness temperature ratios |
 |
Figure 11: Boltzmann plots from the CH3OH(3-2) and (5-4) lines. The column densities are source averaged assuming the deconvolved angular diameters given in Table 11 for CH3OH. The straight lines represent least square fits to the data. The derived rotation temperatures and column densities are given in Table 12 |
 |
 |
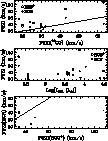
Figure 18: Top panel: full width at zero intensity of the HCN(1-0) (filled points) and HCO+(1-0) (empty) lines as a function of the FWZI of the 12CO(1-0) line (from Table 2). Middle panel: same as above as a function of the luminosity of the IRAS source. Bottom panel: FWZI of the HCN(1-0) line versus the FWZI of the HCO+(1-0) line |
In summary, IRAS20126+4104 represents a rare beautiful example of a disk-outflow system originating from a young early type massive (proto)star still in an evolutionary phase prior to the development of an UC HII region.
The IC 1396-N (or IC 1396E) globule has been studied
in detail by Serabyn et al. (1993)
using molecular line data taken with the Effelsberg 100-m, the
IRAM 30-m, and the CSO 10.4-m telescopes. In particular, they obtained
maps in CS(3-2) which well compare with ours, although the region
mapped by them is larger.
They determined the mass of the globule to be 480 ![]() within an
outer radius of 0.9 pc and with a density distribution varying as
r-1.75. From the ammonia measurements, they determined the
temperature to be 20-23 K. With this model, they predicted an
intensity of 1.6-1.9 K for C34S(3-2) with the 30-m or 35%
larger than our observed value of 1.3 K. They find the wing
emission (-7.25 to -1.25 km s-1 and 2.75 to 8.75 km s-1) to be
localised around the water maser source whereas the bulk emission
(i.e. from -1.25 to 2.75 km s-1) is more extended. Indeed our
results are quite consistent with this view. However, in their Fig. 5
Serabyn et al. present the CS(3-2) line emission integrated under
both line wings: if one instead compares the emission in the blue wing
with that in the red, an offset in the E-W direction between the two is found.
This is shown in Fig. 16, where the same velocity intervals
as in Fig. 5 of Serabyn et al. (1993) have been used.
Note that such an offset and orientation is also found in an interferometric
map of the HCO+(1-0) emission (Testi, private communication).
One possibility is that the structure outlined in Fig. 16
is a bipolar flow, although it should be noted
that only the blue lobe is peaked at the centre position,
namely where the bulk CS(3-2) emission peaks.
Whatever the interpretation, the structure
of the molecular cloud in this source is not as simple as assumed
by Serabyn et al. (1993). Although to a first approximation
one can make the hypothesis of a single homogeneous clump, in practice
the line profiles shown in Fig. 1j demonstrate that
sub-structures must exist, and temperature and density gradients must
play an important role - as witnessed e.g. by the self-absorption
features in the HCO+ line.
within an
outer radius of 0.9 pc and with a density distribution varying as
r-1.75. From the ammonia measurements, they determined the
temperature to be 20-23 K. With this model, they predicted an
intensity of 1.6-1.9 K for C34S(3-2) with the 30-m or 35%
larger than our observed value of 1.3 K. They find the wing
emission (-7.25 to -1.25 km s-1 and 2.75 to 8.75 km s-1) to be
localised around the water maser source whereas the bulk emission
(i.e. from -1.25 to 2.75 km s-1) is more extended. Indeed our
results are quite consistent with this view. However, in their Fig. 5
Serabyn et al. present the CS(3-2) line emission integrated under
both line wings: if one instead compares the emission in the blue wing
with that in the red, an offset in the E-W direction between the two is found.
This is shown in Fig. 16, where the same velocity intervals
as in Fig. 5 of Serabyn et al. (1993) have been used.
Note that such an offset and orientation is also found in an interferometric
map of the HCO+(1-0) emission (Testi, private communication).
One possibility is that the structure outlined in Fig. 16
is a bipolar flow, although it should be noted
that only the blue lobe is peaked at the centre position,
namely where the bulk CS(3-2) emission peaks.
Whatever the interpretation, the structure
of the molecular cloud in this source is not as simple as assumed
by Serabyn et al. (1993). Although to a first approximation
one can make the hypothesis of a single homogeneous clump, in practice
the line profiles shown in Fig. 1j demonstrate that
sub-structures must exist, and temperature and density gradients must
play an important role - as witnessed e.g. by the self-absorption
features in the HCO+ line.
In this source the H2O masers are slightly offset from the peak of the C34S emission (see Fig. 8), although likely embedded in the C34S clump. By inspection of Fig. 1l, one sees that two velocity components are detected in the HCO+(1-0) and, perhaps, HCN(1-0) lines. Indeed, the region mapped in these transitions looks more extended than that seen in CS or 13CO (see Fig. 3g). The complexity of the molecular cloud is better evidenced by separating the contribution of the two velocity components in the HCO+ line. This is done in Fig. 17 where the distribution of the HCO+ line emission integrated from -60 to -55 km s-1 is compared with that from -55 to -48 km s-1. Figure 17 seems to outline two clumps, neither of which can be safely associated with the H2O maser spots. Under this respect IRAS23151+5912 differs from all the other sources. Clearly, the situation is more complex in this case: a tentative explanation may be that the H2O masers are located in a high density region at the interface between the two clumps. Any further speculation will require higher angular resolution data.
Copyright The European Southern Observatory (ESO)