When using usual period search methods, the well known problem of aliasing can produce spurious periods. On the basis of the phase diagram only, these periods can not be rejected. However, the variogram can be used as a complementary method. It can be very helpful to rule out certain periods, or to increase the level of confidence in others. The accurate determination of the period is left to the usual period search algorithm.
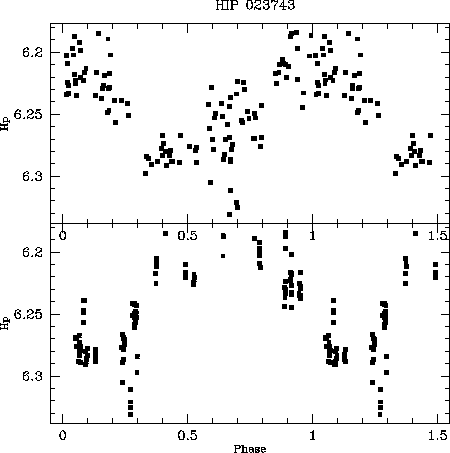 |
Figure 6: Phase diagram for the star HIP 023743. Above the data is folded with the period p1=3.348 days. Below, with the period p2=80.9 days |
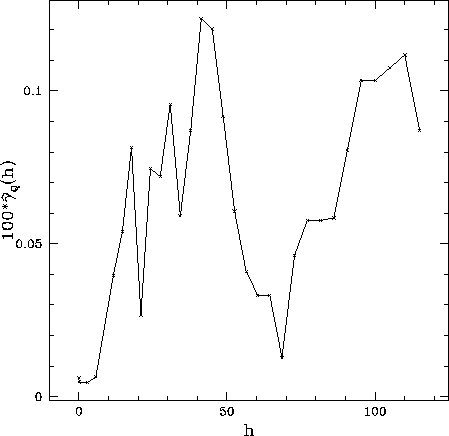
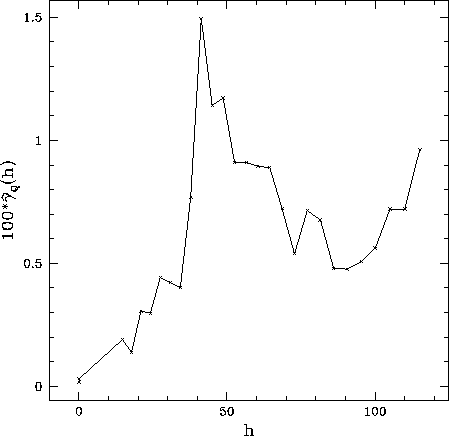
Here we present an example of such a situation. The star HIP 023743 has in its power spectrum two possible periods: p1=3.348 days and p2=80.9 days. The associated phase diagrams are presented for these two possibilities in Fig. 6. Both seem to be reasonable. However, with the variogram, the short period can be eliminated. As we see in Fig. 7, there is no evidence of variability signature for the periods shorter than 3 days which could explain the dispersion of the data. Figure 6 shows that the phase diagrams both have the same amplitude of approximately 0.07. Figure 7 does not reveal any such amplitude around p1=3.348, whereas it does around p2=80.9. This case is also instructive because the minimum of the variogram does not exactly coincide with the period p2=80.9 days. This is due to the irregularity and scarcity of the pairwised differences near h=80.
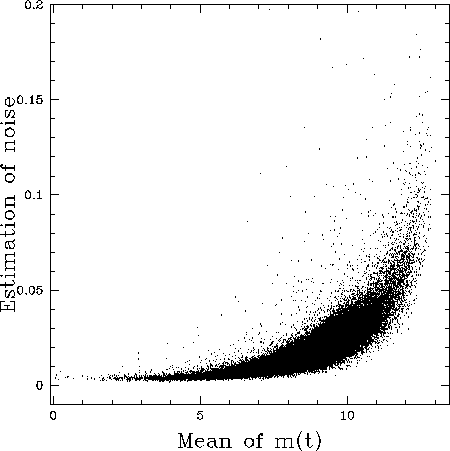
The precision on the Hipparcos magnitudes is strongly variable. It can be interesting to know its dependence with respect to the magnitude. As already said, the nugget value can be viewed as a good estimator of the noise. Only the very short pairwised time differences are used (h=20 minutes or h=108 minutes). The underlying assumption is that very few variable stars have detectable variability at lags around h=20 minutes.
In fact the law (cf. Fig. 8) is very close to the one obtained by Eyer & Grenon (1997). For a given magnitude, the dispersion can be high and the degradation is very rapid (exponential). Furthermore there are some outliers which are caused by some problems of the satellite like light pollution from companions, mispointing, or by rapid oscillations of stars.
Based on Fig. 8, a set of potentially interesting stars was selected on which a high frequency analysis has been performed. As a result we found three periodic variable stars (HIP 071119, HIP 044025 and HIP 029055) which are not in the published catalogues (Grenon et al. 1997 and van Leeuwen et al. 1997).
The method permits also to compare our estimated noise with
the quoted errors ![]() , furnished in the Hipparcos
photometric data base. For a given star we define a mean error
by
, furnished in the Hipparcos
photometric data base. For a given star we define a mean error
by ![]() , and a highly
robust noise estimator
, and a highly
robust noise estimator ![]() ,with h=20 min.
In order to confirm the adequacy of the method, a simulation is
carried out on the 118204 stars. The magnitudes m(ti) are
drawn from a Gaussian distribution with constant mean and
variance
,with h=20 min.
In order to confirm the adequacy of the method, a simulation is
carried out on the 118204 stars. The magnitudes m(ti) are
drawn from a Gaussian distribution with constant mean and
variance ![]() . Then, the estimator
. Then, the estimator ![]() is
calculated on the simulated m(ti) for each star.
is
calculated on the simulated m(ti) for each star.
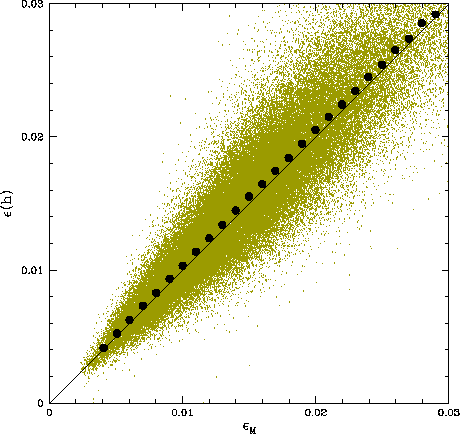 |
Figure 9:
Simulated measurement noise using the highly robust noise estimator |
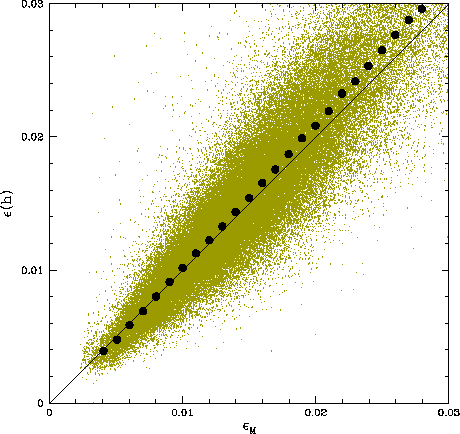 |
Figure 10:
Estimated measurement noise of the Hipparcos data using
the highly robust noise estimator |
We compare the two estimators ![]() and
and ![]() in Fig. 9 for the simulated data; a moving median is computed
and is represented by the filled circles, indicating a reasonable
match between the two noise estimators. In Fig. 10, the estimated
noise of the Hipparcos real data is represented following the
same method. The slope of the moving medians is 1.09 indicating
a 9% bias probably due to
in Fig. 9 for the simulated data; a moving median is computed
and is represented by the filled circles, indicating a reasonable
match between the two noise estimators. In Fig. 10, the estimated
noise of the Hipparcos real data is represented following the
same method. The slope of the moving medians is 1.09 indicating
a 9% bias probably due to ![]() .It seems that for small
.It seems that for small ![]() the
the ![]() can be
overestimated whereas for large
can be
overestimated whereas for large ![]() the
the ![]() are
underestimated in the Hipparcos data base.
As a consequence, when doing a photometric variability analysis,
some bright variable stars might be taken as constant,
and some constant faint stars might be taken as variable.
are
underestimated in the Hipparcos data base.
As a consequence, when doing a photometric variability analysis,
some bright variable stars might be taken as constant,
and some constant faint stars might be taken as variable.
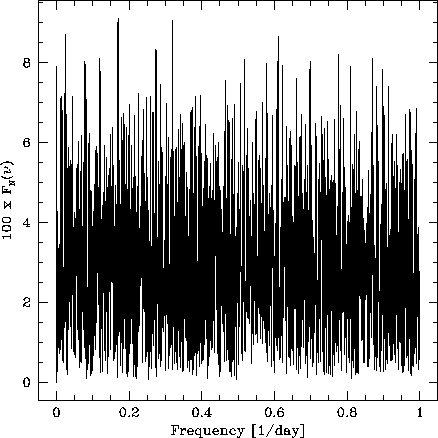 |
Figure 13: Fourier power spectrum of the star HIP 060998. Although a characteristic time-scale can be given in the variogram (Fig. 12), the power spectrum is noisy |
Copyright The European Southern Observatory (ESO)