Some ![]() -ray loud blazars have been observed several times with EGRET
while three XBLs have been observed to show TeV radiations. In the following
section, we present the
-ray loud blazars have been observed several times with EGRET
while three XBLs have been observed to show TeV radiations. In the following
section, we present the ![]() -ray loud blazars with available
-ray loud blazars with available
![]() -ray variation
timescales. Because the variability timescale corresponds to different
variation amplitude for different source and/or different observation
period, we use the doubling timescale,
-ray variation
timescales. Because the variability timescale corresponds to different
variation amplitude for different source and/or different observation
period, we use the doubling timescale,
![]() , as the variability
timescale.
, as the variability
timescale.
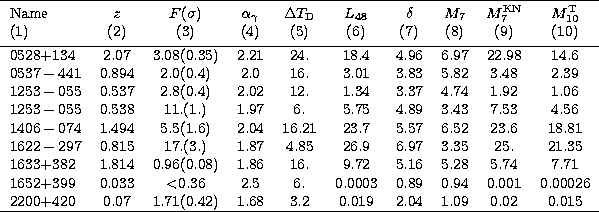
PKS 0528+134, z = 2.07 (Hunter et al. 1993), is one of the most luminous examples of blazars. It is observed by EGRET, COMPTE and OSSE aboard the CGRO (see Hunter et al. 1993; McNaron-Brown et al. 1995; Mukherjee et al. 1996; Collmar et al. 1997; Sambruna et al. 1997).
During the period of 16-30 May 1991, the source showed
F(>100 MeV) = (1.0 ![]() 0.2) 10-6 photon cm-2 s-1
with photon spectral index
0.2) 10-6 photon cm-2 s-1
with photon spectral index ![]() .
.
During 23-29 March 1993,
F(>100 MeV) = (0.23 ![]() 0.12 - 3.08
0.12 - 3.08 ![]() 0.35)
10-6 photon cm-2 s-1; with a photon spectral
index
0.35)
10-6 photon cm-2 s-1; with a photon spectral
index ![]() = 2.21
= 2.21 ![]() 0.10. In the 1993 observation,
a variation of order 100% over a timescale of
0.10. In the 1993 observation,
a variation of order 100% over a timescale of ![]() 2
days was detected (see Wagner et al. 1997), which suggests a doubling time
scale of
2
days was detected (see Wagner et al. 1997), which suggests a doubling time
scale of ![]() = 1 day.
= 1 day.
During August, 1994,
F(>100 MeV) = (0.32 ![]() 0.1) 10-6 photon cm-2 s-1;
with a photon spectral index
0.1) 10-6 photon cm-2 s-1;
with a photon spectral index ![]() = 2.70.
= 2.70.
There is a clear evidence that the spectrum becomes harder when the
![]() -ray flux increases.
-ray flux increases.
PKS 0537-441, z = 0.896, a candidate of gravitational lens
(Surpi et al. 1996), is a violently variable object
(Fan & Lin 1998).
The ![]() -ray flux varies from (1.83
-ray flux varies from (1.83 ![]() 0.91) to
(8.98
0.91) to
(8.98 ![]() 1.45) 10-6 photon cm-2 s-1
(Mukherjee et al. 1997). A flare of a factor of
1.45) 10-6 photon cm-2 s-1
(Mukherjee et al. 1997). A flare of a factor of ![]() 3
from 0.35 to 2.0 10-6 photon cm-2s-1 over a time
scale of
3
from 0.35 to 2.0 10-6 photon cm-2s-1 over a time
scale of ![]() 2 days can be seen from Fig. 3 in Hartman's paper
(Hartman 1996).
2 days can be seen from Fig. 3 in Hartman's paper
(Hartman 1996). ![]() = 16 hr.
= 16 hr.
3C 279 is a well known member of OVV subclass of blazars. it is perhaps
the prototypical superluminal radio source (Moffet et al. 1972); and the
first quasar detected at the energies of >1 GeV with EGRET/
CGRO.
The simultaneous variability in X-rays and ![]() -rays (> 100 MeV)
suggests for the first time that they are approximately cospatial
(M
-rays (> 100 MeV)
suggests for the first time that they are approximately cospatial
(M![]() Hardy 1996). The
Hardy 1996). The ![]() -ray flux varies from 1.28 to 28.7
10-6 photon cm-2 s-1 (Mukherjee et al. 1997).
Two
-ray flux varies from 1.28 to 28.7
10-6 photon cm-2 s-1 (Mukherjee et al. 1997).
Two ![]() -ray flares were detected (see Kniffen et al. 1993;
Hartman et al. 1996; M
-ray flares were detected (see Kniffen et al. 1993;
Hartman et al. 1996; M![]() Hardy 1996;
Wehrle et al. 1998).
Hardy 1996;
Wehrle et al. 1998).
The 16-28 June 1991 flare showed:
F(>100 MeV) = (2.8 ![]() 0.4) 10-6 photon cm-2 s-1
with a photon spectral index
0.4) 10-6 photon cm-2 s-1
with a photon spectral index ![]() = 1.89
= 1.89 ![]() 0.06. A variation
of a factor of 4 over 2 days was obtained.
0.06. A variation
of a factor of 4 over 2 days was obtained.
The January-February 1996 flare showed (see McHardy 1996;
Wehrle et al. 1998),
F(>100 MeV) = (11.0 ![]() 1.) 10-6 photon cm-2 s-1
with a photon spectral index
1.) 10-6 photon cm-2 s-1
with a photon spectral index ![]() = 1.97
= 1.97 ![]() 0.07. During this
flare, a variation
of a factor of 4
0.07. During this
flare, a variation
of a factor of 4 ![]() 5 in a day is observed,
5 in a day is observed,
![]() hrs (Wehrle et al. 1998).
hrs (Wehrle et al. 1998).
No obvious spectral index variation has been detected when the flux varied.
PKS 1406-074 has been detected to vary with the ![]() -ray flux being in
the range of 1.54 to 12.76 10-6 photon cm-2 s-1
(Mukherjee et al. 1997). During its
-ray flux being in
the range of 1.54 to 12.76 10-6 photon cm-2 s-1
(Mukherjee et al. 1997). During its ![]() -ray flare, a flux of
F(>100 MeV) = (5.5
-ray flare, a flux of
F(>100 MeV) = (5.5 ![]() 1.4) 10-6 photon cm-2 s-1
with a photon spectral index
1.4) 10-6 photon cm-2 s-1
with a photon spectral index ![]() = 2.04
= 2.04 ![]() 0.15 and a
doubling
timescale of shorter than 16 hours has been obtained (see
Wagner et al.
1995).
0.15 and a
doubling
timescale of shorter than 16 hours has been obtained (see
Wagner et al.
1995).
For PKS 1622-297, z=0.815, we have very little information in lower
energy bands. But it
is one of the most luminous objects in the ![]() -ray region. A peak
flux of (17
-ray region. A peak
flux of (17 ![]() 3) 10-6 photon cm-2 s-1 (E>100 MeV)
and a
flux increase by a factor of 2 in 9.7 hours were observed
(Mattox et al.
1997).
3) 10-6 photon cm-2 s-1 (E>100 MeV)
and a
flux increase by a factor of 2 in 9.7 hours were observed
(Mattox et al.
1997).
Quasar 1633+382, z=1.814, is an LPQ (![]() ,Moore & Stockman
1984). During 1992 November 17 - December 1 period, it was detected to
show a flux of
F(>100 MeV) = (0.30
,Moore & Stockman
1984). During 1992 November 17 - December 1 period, it was detected to
show a flux of
F(>100 MeV) = (0.30 ![]() 0.06) 10-6 photon cm-2 s-1
with a photon spectral index
0.06) 10-6 photon cm-2 s-1
with a photon spectral index ![]() = 1.87
= 1.87 ![]() 0.07.
The flux varied by it a factor of 1.5 within 24 hr,
0.07.
The flux varied by it a factor of 1.5 within 24 hr, ![]() = 16 hrs,
while the spectral index did not change. The
= 16 hrs,
while the spectral index did not change. The ![]() -ray luminosity is
at least two orders of magnitude larger than the maximum ever observed
in any other band (see Mattox et al. 1993).
-ray luminosity is
at least two orders of magnitude larger than the maximum ever observed
in any other band (see Mattox et al. 1993).
Mkn 501, z=0.033, together with other two XBLs
are three known TeV ![]() -ray sources detected by the Whipple group
(see Quinn et al. 1996; Catanese et al. 1997a;
Samuelson et al. 1998;
Kataoka et al. 1998).
-ray sources detected by the Whipple group
(see Quinn et al. 1996; Catanese et al. 1997a;
Samuelson et al. 1998;
Kataoka et al. 1998).
During 1995 March-July period, Mkn 501 was observed to show a flux of
F(>300 GeV) = (8.1 ![]() 1.4) 10-12 photon cm-2 s-1
with a photon spectral index
1.4) 10-12 photon cm-2 s-1
with a photon spectral index ![]() = 2.2. A variation of
a factor of 4 over one day is also detected,
= 2.2. A variation of
a factor of 4 over one day is also detected, ![]() = 6 hrs.
The upper limit corresponds to
a flux of F(>100 MeV) = 1.5 10-7 photon cm-2 s-1
(see Quinn et al. 1996). During the 1996 multiwavelength campaign, Mkn 501
was detected with EGRET a flux of F(>100 MeV) =
= 6 hrs.
The upper limit corresponds to
a flux of F(>100 MeV) = 1.5 10-7 photon cm-2 s-1
(see Quinn et al. 1996). During the 1996 multiwavelength campaign, Mkn 501
was detected with EGRET a flux of F(>100 MeV) =
![]() 10-6 photon cm-2 s-1 with a photon index
of 1.6
10-6 photon cm-2 s-1 with a photon index
of 1.6 ![]() 0.5 (see Kataoka et al. 1998). During 1997 April 9-19
observation, Catanese et al. (1997a) obtained
F(>300 GeV) = (40.5
0.5 (see Kataoka et al. 1998). During 1997 April 9-19
observation, Catanese et al. (1997a) obtained
F(>300 GeV) = (40.5 ![]() 9.6) 10-11 photon cm-2
s-1,
9.6) 10-11 photon cm-2
s-1,
![]() = 2.5, the April 9-15 flux corresponds to
a flux of F(>100 MeV) < 3.6 10-7 photon cm-2 s-1.
= 2.5, the April 9-15 flux corresponds to
a flux of F(>100 MeV) < 3.6 10-7 photon cm-2 s-1.
The TeV observations show that the spectrum softens when the source brightens.
2200+420 is the prototype of BL Lacertae class. It is variable in all
wavelengths (see Fan et al. 1998b, 1998c; Bloom et al. 1997;
B![]() ttcher
& Bloom 1998; Madejski et al. 1998). A 14-year period was found in the
optical light curve (Fan et al. 1998b). During 1995 January 24 - February 14,
BL Lacertae showed a flux of
F(>100 MeV) = (40
ttcher
& Bloom 1998; Madejski et al. 1998). A 14-year period was found in the
optical light curve (Fan et al. 1998b). During 1995 January 24 - February 14,
BL Lacertae showed a flux of
F(>100 MeV) = (40 ![]() 12) 10-8 photon cm-2 s-1
with a photon spectral index
12) 10-8 photon cm-2 s-1
with a photon spectral index ![]() = 2.2
= 2.2 ![]() 0.3, the up limit
flux in higher energy is F(>300 GeV) < 0.53 10-11
photon cm-2 s-1 (Catanese et al. 1997b). During 1997 January
15/22 observation period, it was detected a flux of F(>100 MeV) =
(171
0.3, the up limit
flux in higher energy is F(>300 GeV) < 0.53 10-11
photon cm-2 s-1 (Catanese et al. 1997b). During 1997 January
15/22 observation period, it was detected a flux of F(>100 MeV) =
(171 ![]() 42) 10-8 photon cm-2 s-1 with a photon
spectral index
42) 10-8 photon cm-2 s-1 with a photon
spectral index ![]() = 1.68
= 1.68 ![]() 0.16 and a dramatic factor
of 2.5 increase within a timescale of 8hrs,
0.16 and a dramatic factor
of 2.5 increase within a timescale of 8hrs, ![]() = 3.2 hrs.
Besides, simultaneous optical and
= 3.2 hrs.
Besides, simultaneous optical and ![]() -ray flares were
observed ruling out external scattering models (see Bloom et al. 1997).
-ray flares were
observed ruling out external scattering models (see Bloom et al. 1997).
The observations from the object show that the spectrum of BL Lacertae
hardens when the ![]() -ray flux increases.
-ray flux increases.
The objects discussed here show variability time scale of hours to days.
The variability could be directly related to shock processes in a jet,
far from the accretion disk (we thank Dr. S.D. Bloom to point out this
for us). If we take the variability timescale as the measurements of
the size, R, of the emission region, then the R in the jet obeys to
the inequality,
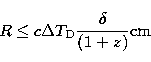 |
(1) |
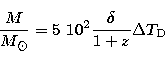
For an object with a mass M, the Eddington limit gives (Frank et al. 1985)
 |
(2) |
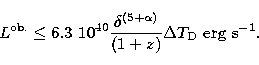
In the relativistic beaming frame, the observed luminosity is
![]() ,
, ![]() is the energy spectral index,
which follows that
is the energy spectral index,
which follows that
| (3) |
 |
(4) |
 |
(5) |
 |
(6) |
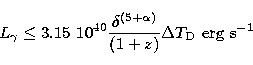
![\begin{displaymath}
\delta \geq \left[{\frac{L_{\gamma}(1+z)}{3.15\ 10^{40}~{\rm erg\ s}^{-1}\Delta
T_{\rm D}}}\right]^{({\frac{1}{5+\alpha}})}.\end{displaymath}](/articles/aas/full/1999/07/ds7917/img45.gif) |
(7) |
Copyright The European Southern Observatory (ESO)