

Up: First DENIS I-band extragalactic catalog
Subsections
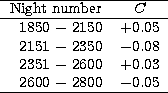
Magnitudes are calibrated by comparison with the measurements in I-band
photometry made by Mathewson et al. (1992, 1996) which gives access to 2441
galaxies. This comparison allows us to correct for a possible
variation of the zero-point. This variation has been explained by seasonal
variation of the mean temperature of the camera![[*]](/icons/foot_motif.gif) . Figure 8 shows such a
variation described by the parameter C:
. Figure 8 shows such a
variation described by the parameter C:
Note that the "night number'' is a logical number, not a real night number.
Each time the system is initialized the night number is incremented. This
explains that after one year of running survey there are 2500 logical nights.
![\begin{figure}
\includegraphics [width=7.9cm]{ds8041f9.eps}\end{figure}](/articles/aas/full/1999/04/ds8041/Timg71.gif) |
Figure 8:
Zero-point variation obtained by comparison with Mathewson's
I-band photometry |
An airmass correction is adopted using a typical value
 sec
sec 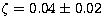 . A check is made to control
that there is no airmass residual. The residual is smaller than 0.01
magnitude. The DENIS I-magnitude is then:
. A check is made to control
that there is no airmass residual. The residual is smaller than 0.01
magnitude. The DENIS I-magnitude is then:
| 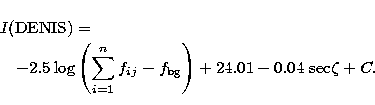 |
|
| (7) |
The zero-point distribution of I(Mathewson) - I(DENIS)
is Gaussian (Fig. 9) with a standard deviation of 0.2 magnitude.
If we assume that the error is identical for both systems the
mean error on DENIS extragalactic I-band magnitudes would be about 0.14
magnitude. Because the uncertainty on Mathewson et al. data is probably
smaller, the uncertainty on our I-band magnitudes is about  magnitude.
![\begin{figure}
\includegraphics [width=7.8cm]{ds8041f10.eps}\end{figure}](/articles/aas/full/1999/04/ds8041/Timg76.gif) |
Figure 9:
Zero-point distribution after a tiny seasonal correction |
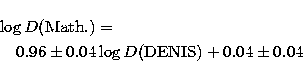
In Fig. 10, the comparison between I(Mathewson) and I(DENIS)
is shown for galaxies with secure identification and being neither
"multiple'' nor "truncated''. The direct regression is:
| 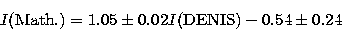 |
(8) |
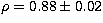
with the following standard deviation, correlation coefficient and number of objects:
 ,
, 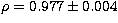 , n=163 after 11 rejections at
  .
.
Stricto sensu, the slope is not significantly different from 1, and the zero-point
is not significantly different from 0. So, we are keeping the conservative
solution: I(Math.)  (DENIS).
Among the 10 rejected galaxies, 8 can be explained by
localized poor photometric conditions (because they correspond to a loss of flux).
The measurements of corresponding nights will be counted with half weight. Two
nights were rejected (night 2475 and 2159) because they give rejections in the
comparison of different photometric parameters.
(DENIS).
Among the 10 rejected galaxies, 8 can be explained by
localized poor photometric conditions (because they correspond to a loss of flux).
The measurements of corresponding nights will be counted with half weight. Two
nights were rejected (night 2475 and 2159) because they give rejections in the
comparison of different photometric parameters.
![\begin{figure}
\includegraphics [width=7.9cm]{ds8041f11.eps}\end{figure}](/articles/aas/full/1999/04/ds8041/Timg82.gif) |
Figure 10:
Comparison of extragalactic I-band
magnitudes from Mathewson et al. and from DENIS |
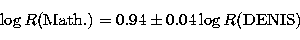
Diameters and axis ratios are also compared with those of Mathewson et al. samples.
These comparisons are given in Fig. 11 and Fig. 12,
respectively. The direct regression are:
|  |
|
| (9) |
with  ,
,  , n=170 after 4 rejections at
.
, n=170 after 4 rejections at
.
For the axis ratio, it is better to force the intercept to be zero as
generally admitted (see de Vaucouleurs et al. 1976). This avoids to have
negative axis ratio after the application of the regression. The result is
thus:
|  |
(10) |
with , 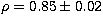 , n=172 after 2 rejections at
.None of these regressions is significantly different from the absolute
identity. So, we will keep:
, n=172 after 2 rejections at
.None of these regressions is significantly different from the absolute
identity. So, we will keep:  (Math.)
  (DENIS) and
 (Math.)
  (DENIS). The standard deviations are 0.10 for
both and . Again, if we assume the same error on both systems
the error on and is about 0.07.
(DENIS). The standard deviations are 0.10 for
both and . Again, if we assume the same error on both systems
the error on and is about 0.07.
![\begin{figure}
\includegraphics [width=7.7cm]{ds8041f12.eps}\end{figure}](/articles/aas/full/1999/04/ds8041/Timg90.gif) |
Figure 11:
Comparison of I-band
isophotal diameters from Mathewson et al. and from DENIS |
![\begin{figure}
\includegraphics [width=7.8cm]{ds8041f13.eps}\end{figure}](/articles/aas/full/1999/04/ds8041/Timg91.gif) |
Figure 12:
Comparison of I-band
axis ratios from Mathewson et al. and from DENIS |
Up: First DENIS I-band extragalactic catalog
Copyright The European Southern Observatory (ESO)
![\begin{figure}
\includegraphics [width=7.9cm]{ds8041f9.eps}\end{figure}](/articles/aas/full/1999/04/ds8041/img71.gif)
![\begin{figure}
\includegraphics [width=7.8cm]{ds8041f10.eps}\end{figure}](/articles/aas/full/1999/04/ds8041/img76.gif)
![\begin{figure}
\includegraphics [width=7.9cm]{ds8041f11.eps}\end{figure}](/articles/aas/full/1999/04/ds8041/img82.gif)
![\begin{figure}
\includegraphics [width=7.7cm]{ds8041f12.eps}\end{figure}](/articles/aas/full/1999/04/ds8041/img90.gif)
![\begin{figure}
\includegraphics [width=7.8cm]{ds8041f13.eps}\end{figure}](/articles/aas/full/1999/04/ds8041/img91.gif)