To study flickering we used both the
power spectra and autocorrelation function (ACF).
As it was mentioned above, PS of MV Lyr show a red noise. Although the
presence of red noise in PS does not specify the underlying source
variability, investigation of PS properties is useful from the point
of view of their comparison with the ones
predicted from the theoretical and numerical models. An important
characteristic in this aspect is the power law index ![]() , as well as
the common shape of the PS.
, as well as
the common shape of the PS.
In order to determine ![]() we plotted PS
in log-log scale and fitted their linear parts by least-squares
linear fit. The interval in which the fits were performed varied from
we plotted PS
in log-log scale and fitted their linear parts by least-squares
linear fit. The interval in which the fits were performed varied from
![]() to
to ![]() (with one exception on Jul. 18, 1993 where
the upper end of the linear part was
(with one exception on Jul. 18, 1993 where
the upper end of the linear part was ![]() ). At frequencies higher than
). At frequencies higher than
![]() the spectra become flat because the white noise
dominates over all other sources of variability.
The values of
the spectra become flat because the white noise
dominates over all other sources of variability.
The values of ![]() are listed
in Table 3 together with the errors determined from fitting program.
The value of
are listed
in Table 3 together with the errors determined from fitting program.
The value of ![]() determined from the mean power
spectrum and the mean
determined from the mean power
spectrum and the mean ![]() from the individual values are
also given in
the table.
from the individual values are
also given in
the table.
The data contain gaps with common length ![]() of
the run length. They cause power leakage effects
and may reduce the power spectrum slope.
To investigate the influence of these gaps on the accuracy of
of
the run length. They cause power leakage effects
and may reduce the power spectrum slope.
To investigate the influence of these gaps on the accuracy of
![]() determination, we used the three
series containing 10% gaps only
(Jul. 06, 1992, Jul. 17 and 19, 1993). The gaps were filled using the
method developed by
Fahlman & Ulrych (1982). After that all original gaps
were enlarged randomly, but keeping their common length 15, 20, 25 and
30% respectively. For every run and common length of the gaps, 100
different gaps
distributions were introduced and the mean values of
determination, we used the three
series containing 10% gaps only
(Jul. 06, 1992, Jul. 17 and 19, 1993). The gaps were filled using the
method developed by
Fahlman & Ulrych (1982). After that all original gaps
were enlarged randomly, but keeping their common length 15, 20, 25 and
30% respectively. For every run and common length of the gaps, 100
different gaps
distributions were introduced and the mean values of ![]() were
compared with those determined from the filled and original runs.
The mean values of
were
compared with those determined from the filled and original runs.
The mean values of ![]() showed slight tendency to decrease
with the growth of the gaps length, but all values remained in the interval
showed slight tendency to decrease
with the growth of the gaps length, but all values remained in the interval
![]() determined from the 100 simulated gaps
distributions.
Because the PS are very noisy, the determination of
determined from the 100 simulated gaps
distributions.
Because the PS are very noisy, the determination of ![]() also depends
strongly on the interval in which the fit is performed.
Small changes in this interval caused changes in the values of
also depends
strongly on the interval in which the fit is performed.
Small changes in this interval caused changes in the values of ![]() reaching 0.2-0.3. So the errors listed in Table 3 should be regarded
as a lower limit.
reaching 0.2-0.3. So the errors listed in Table 3 should be regarded
as a lower limit.
The time scale
of the flickering is not an easily definable quantity. An objective way to
define it is by autocorrelation function (ACF). The typical time scale
of the flickering ![]() may be defined as the time shift at which
the ACF
may be defined as the time shift at which
the ACF ![]() first accepts the value r0=1/e. Thus determined
correlation times are strongly biased from the presence of periodic
brightness variations or some trends in the data. In order to flee the
influence of these factors the following procedure was applied. The runs
were divided into non-overlapping sections of
first accepts the value r0=1/e. Thus determined
correlation times are strongly biased from the presence of periodic
brightness variations or some trends in the data. In order to flee the
influence of these factors the following procedure was applied. The runs
were divided into non-overlapping sections of
![]() min each and the
average points in these bins were interpolated by cubic spline. This
roughly corresponds to output from a filter cutting modulations with
periods approximately longer than 40 min. Finally the residuals between
the original data and the smooth curve were analysed. Because of gaps
in the observations the ACFs were calculated according to
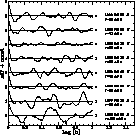
Edelson & Krolik (1988) and are shown in Fig. 4. The bin sizes were
chosen to be equal to integration time. Determined correlation times
listed in Table 3 are of the order of 1.5 min. The errors are determined from
shift times at which the functions
min each and the
average points in these bins were interpolated by cubic spline. This
roughly corresponds to output from a filter cutting modulations with
periods approximately longer than 40 min. Finally the residuals between
the original data and the smooth curve were analysed. Because of gaps
in the observations the ACFs were calculated according to
Edelson & Krolik (1988) and are shown in Fig. 4. The bin sizes were
chosen to be equal to integration time. Determined correlation times
listed in Table 3 are of the order of 1.5 min. The errors are determined from
shift times at which the functions
![]() first reach
the value r0=1/e, where
first reach
the value r0=1/e, where ![]() are
the errors of the autocorrelation
coefficients. In the table is also given the mean from the individual values.
As Robinson & Nather (1971)
and Panek (1980) note, these correlation
times can be additionally biased by the presence of weakly correlated
noise and the way of trend removal.
are
the errors of the autocorrelation
coefficients. In the table is also given the mean from the individual values.
As Robinson & Nather (1971)
and Panek (1980) note, these correlation
times can be additionally biased by the presence of weakly correlated
noise and the way of trend removal.
 |
Figure 4: Autocorrelation functions of MV Lyr light curves. Bars show the errors of the autocorrelation coefficients |
The determined values of ![]() vary in the interval from 1.60 to 2.15.
There are several mechanisms which may produce PS with power law shape
and
vary in the interval from 1.60 to 2.15.
There are several mechanisms which may produce PS with power law shape
and ![]() in this interval (see Tremko et al. 1996). The low
frequency flat part of PS allows us to suggest a model of the optical
variability in terms of a "shot noise" process. According to this model
the light curves are the result of overlapping, randomly distributed in
time shots with some shape. In the classic "shot noise" model the
shots are assumed as decaying exponents. Then PS shape is:
in this interval (see Tremko et al. 1996). The low
frequency flat part of PS allows us to suggest a model of the optical
variability in terms of a "shot noise" process. According to this model
the light curves are the result of overlapping, randomly distributed in
time shots with some shape. In the classic "shot noise" model the
shots are assumed as decaying exponents. Then PS shape is:
 |
(2) |
 |
(3) |
 |
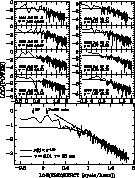
Figure 5:
Individual and mean PS of non-detrended runs fitted to function
|
The total amplitude of the flickering (i.e. the difference between the
brightest and faintest points of the light curve) and standard deviation
around the mean are listed in Table 3 also. There seems to be
no difference between activity of the flickering in B and U bands
if these quantities are taken as activity indication. Having an
estimation of the total amplitude of the flickering we can calculate
the contribution of the flickering light source to the total light
of the star following the conception of Bruch (1992).
The star
brightness can be regarded as a sum of two sources - flickering light
source and all other sources which are supposed to be constant on the
flickering time scale. The magnitude of the constant light source
can be defined as ![]() , where m is the mean
magnitude of MV Lyr and
, where m is the mean
magnitude of MV Lyr and ![]() is the total amplitude of the
flickering. Then, if the amplitude of the flickering
is assumed to be independent of the passband, the
ratio of the flux of the flickering light source
is the total amplitude of the
flickering. Then, if the amplitude of the flickering
is assumed to be independent of the passband, the
ratio of the flux of the flickering light source ![]() to that
of the constant ones
to that
of the constant ones ![]() over the whole optical range is
given by
over the whole optical range is
given by
 |
(4) |
Recently the most often discused mechanisms causing the flickering are turbulence in the accretions disc and/or unstable mass accretion on the white dwarf. These are stochastic processes and the resulting light curves would be described as a "shot noise". Although the flickering in cataclysmic variables is often discussed in terms of standard "shot noise" model (Williams & Hiltner 1984; Elsworth & James 1982; Panek 1980), it should be regarded only as a rough approximation. More complicated models should take into account the distribution of shot's durations which can change significantly the power spectra shape. Unfortunately, because of the overlapping of the shots, this distribution cannot be found from the light curves.
Copyright The European Southern Observatory (ESO)