The observed colour-magnitude (CM) and colour-colour (CC) diagrams of NGC2354 with the stars listed in Table 2 are shown in Figs. 1 and 2. The selection process for cluster membership is here primarily based on the radial velocity data.
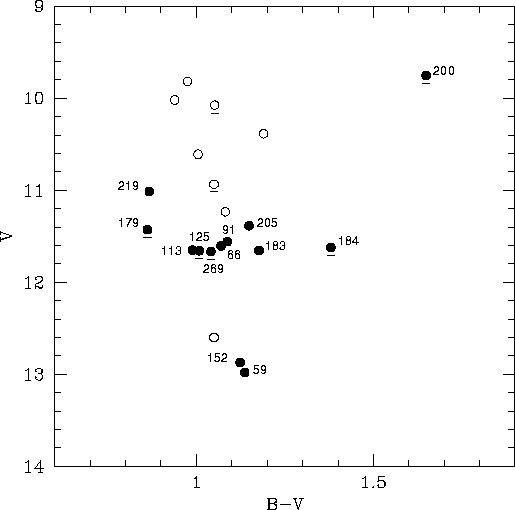 |
Figure 1: The colour-magnitude diagram for red giant stars in NGC2354. Confirmed or possible cluster members and red field stars are represented by filled and open circles, respectively. Spectroscopic binaries (underlined) are also indicated. The distance between the apparent ascending giant branch and the clump is much too large when compared to theoretical models |
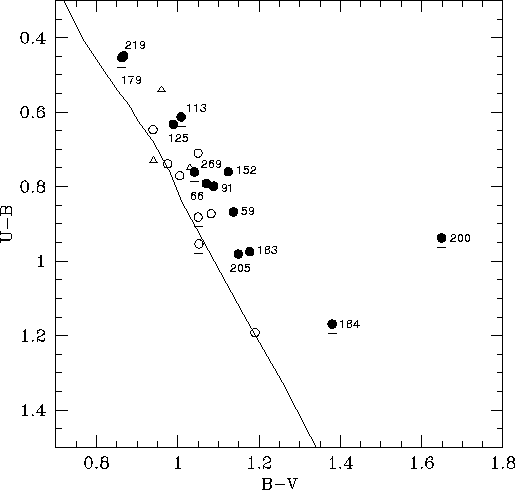 |
Figure 2: The UBV two-colour diagram for the same stars as in Fig. 1, with the same notation. Triangles represent photographic data from Dürbeck (1960). The continuous curve is the standard two-colour relationship for typical G and K giants as given by Fitzgerald (1970). Star #200 has a peculiar U-B colour |
Fourteen stars with mean radial velocities larger than 40 km s-1 or lower than 20
km s-1 are undoubtedly non-members, four of them most probably spectroscopic binaries
(see Table 3). The radial velocities of six non-SB obvious members from Table 4
(stars #66, 91, 125, 152, 183 and 205) fall within an interval of only 1.7 km s-1.
The mean radial velocity of these stars is 33.40  0.27 km s-1 (s.e. of
the mean) and has been adopted for NGC2354.
0.27 km s-1 (s.e. of
the mean) and has been adopted for NGC2354.
When the mean radial velocities of some stars differ by some 2 - 2.5 km s-1
from the cluster mean velocity, i.e. differences well larger than 3  , it is more
difficult to derive the membership from the radial velocity only. The examination of the
colour-magnitude diagram may provide further help to the decision. Generally, there is a
very good agreement between the kinematic and photometric membership estimates, but
in the case of NGC 2354, there appear to be some contradictions. Although
it is formally possible to compute membership probabilities, practically the results
do not bring much insight in the membership determination. The six stars listed above
would have high membership probabilities, and all other would be close to 0. In fact it does
not properly take into account the case of the binaries, because the rough mean velocities
are not fully representative of the true mean values. Further observations, and not only
radial velocities, but also proper motions, are needed to settle the point.
, it is more
difficult to derive the membership from the radial velocity only. The examination of the
colour-magnitude diagram may provide further help to the decision. Generally, there is a
very good agreement between the kinematic and photometric membership estimates, but
in the case of NGC 2354, there appear to be some contradictions. Although
it is formally possible to compute membership probabilities, practically the results
do not bring much insight in the membership determination. The six stars listed above
would have high membership probabilities, and all other would be close to 0. In fact it does
not properly take into account the case of the binaries, because the rough mean velocities
are not fully representative of the true mean values. Further observations, and not only
radial velocities, but also proper motions, are needed to settle the point.
Stars #59 and 219 differ by 2.1 and 2.2 km s-1 from this mean velocity so that they
are possible cluster members. They could be long period, low amplitude binaries with an
eccentric orbit. The position of both stars in the colour-magnitude diagram (Fig. 1)
may also indicate that they are non-member. However, star #59 falls very close to star #152,
which has a radial velocity (33.84 km s-1) very close to the cluster mean. Star #219 has
a high  , like #179 which is a binary. The status of star #184, a possible
spectroscopic binary, is difficult to decide because it has a radial velocity close to the
cluster mean but its position in Figs. 1 and 2 falls also too red, if one
uses available isochrones to analyse the distribution of the red giants in the colour-magnitude
diagram of NGC 2354. Finally, #200, the brightest red giant contributes to the definition
of a plausible ascending giant branch.
, like #179 which is a binary. The status of star #184, a possible
spectroscopic binary, is difficult to decide because it has a radial velocity close to the
cluster mean but its position in Figs. 1 and 2 falls also too red, if one
uses available isochrones to analyse the distribution of the red giants in the colour-magnitude
diagram of NGC 2354. Finally, #200, the brightest red giant contributes to the definition
of a plausible ascending giant branch.
The mean velocities of the confirmed spectroscopic binaries #113, 179 and 269 are based on observations not well distributed with respect to the mean cluster velocity as a result of the telescope time allocation. Accordingly, they are not yet representative of the real mean velocities of these stars. Although these mean values differ by about 5.3, 4.7 and 5.8 km s-1 from the cluster mean, these stars are considered as probable members, because the observed individual radial velocities for each star do scatter around the cluster mean. A definitive statement about their membership will await more observations and the determination of the orbits.
With the exception of stars #59, 152, 184 and 200, all the remaining
members form an elongated clump of stars near V  11.5 in the CM diagram. The
position of stars #179 and 219 in the CM diagram is due to their binary character,
certain for star #179 and probable for 219. The morphology of the CM diagram will be
discussed later.
11.5 in the CM diagram. The
position of stars #179 and 219 in the CM diagram is due to their binary character,
certain for star #179 and probable for 219. The morphology of the CM diagram will be
discussed later.
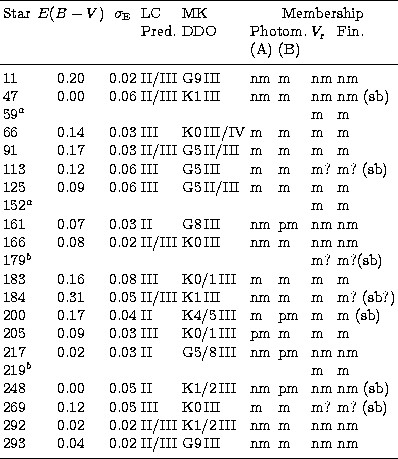
Cluster membership was also examined by applying the photometric criteria A and B described by Clariá & Lapasset (1983). Taking into account the different combinations that might result from the application of both criteria, we decided to consider a star to have a high probability of being a cluster member if one (or both) of the criteria implies membership, while the other indicates that the star is a probable member. If one criterion (or both) suggests non-membership, the star is rejected as a cluster member. Finally, if both criteria simultaneously indicate probable membership, the star is then considered to be a probable member of the cluster.
To apply criteria A and B, the colour excess E(B-V) = 0.15 mag and true
distance modulus (m-M)0 = 10.80 both derived by Ahumada & Lapasset (1996)
were adopted. The DDO colours were dereddened according to the reddening
coefficients of McClure (1973) and the predicted luminosity class for
each observed star was determined from the Schmidt-Kaler (1982) calibration
assuming R = Av/E(B-V) = 3.0.
= 0.15 mag and true
distance modulus (m-M)0 = 10.80 both derived by Ahumada & Lapasset (1996)
were adopted. The DDO colours were dereddened according to the reddening
coefficients of McClure (1973) and the predicted luminosity class for
each observed star was determined from the Schmidt-Kaler (1982) calibration
assuming R = Av/E(B-V) = 3.0.
Columns (6)-(9) of Table 4 contain the results from applying the photometric
and kinematic criteria and the membership status finally adopted for each
star (sb = spectroscopic binary, m = member, nm = non-member). Column (2) of
Table 4 lists the E(B-V) colour excesses derived from
Janes's (1977) iterative procedure, which is abundance independent and
valid over a wide range of luminosities for Population I stars. The standard
deviation
colour excesses derived from
Janes's (1977) iterative procedure, which is abundance independent and
valid over a wide range of luminosities for Population I stars. The standard
deviation  , calculated from Clariá's (1985) Eq. (10)
is given in Col. (3), while Cols. (4) and (5) include the predicted
luminosity class (LC) and the MK spectral type inferred from the dereddened
DDO colours.
, calculated from Clariá's (1985) Eq. (10)
is given in Col. (3), while Cols. (4) and (5) include the predicted
luminosity class (LC) and the MK spectral type inferred from the dereddened
DDO colours.
|
|
Although the results obtained from criterion A should be taken with caution because of the probable non-uniform reddening in the cluster field (Ahumada & Lapasset 1996), the agreement between the photometric analysis and the kinematic data is really excellent. This demonstrates once again that the photometric criteria A and B lead to reliable membership results provided the BV and DDO photometric data are of high quality. The only discrepant star (#184), an apparent radial velocity member, has a reddening significantly larger than those of the cluster giants (see Table 4), compatible with its position in the CM and CC diagrams. Since this star is located in an apparently obscured region in the cluster field and has a metal content nearly similar to that of the remaining red giants (see Sect. 3.2.1), we have retained it as a possible cluster member.
The interstellar reddening derived from Janes's (1977) method average to
<E(B-V)> = 0.13 0.03 mag, in very good agreement with the
previous values derived by Dürbeck (1960) and Ahumada & Lapasset
(1996).
However, the individual E(B-V) values listed in Table 4 were used
to correct the DDO photometry for interstellar reddening.
As a first abundance indicator, we have used the intrinsic DDO colour index
C0(41-42), which is an excellent abundance indicator measuring
the strength of the  4216 cyanogen band, such that the larger
the index the greater the absorption by this band. Using this parameter we
have computed for each cluster red giant the new cyanogen anomaly,
4216 cyanogen band, such that the larger
the index the greater the absorption by this band. Using this parameter we
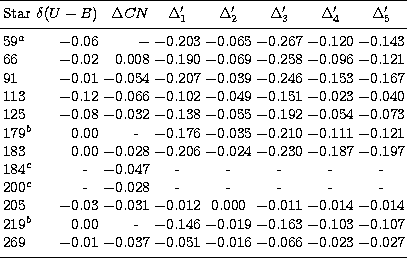
have computed for each cluster red giant the new cyanogen anomaly,  ,defined by Piatti et al. (1993) as the difference between the dereddened
C0(41-42) and the standard value of this index corresponding to a star
with the same temperature and surface gravity, but not with the same
C0(42-45) and C0(45-48) as the star in question. Column (3) of Table 5
lists the cyanogen anomaly obtained for nine cluster giants. No value
could be determined for stars #59, 179 and 219 which fall outside the range of
Piatti et al. (1993) calibration.
The mean cyanogen anomaly is <> = -0.035 0.007 (m.e.), the
negative sign indicating a weak cyanogen band compared with the mean for
solar neigbourhood K giants. The cluster metallicity derived from the [Fe/H]
versus relation given by Piatti et al. (1993) is then [Fe/H] =
-0.29 0.10. We note that the DDO abundance derived for star #184
([Fe/H] = -0.3) suggests again that this is a cluster giant.
,defined by Piatti et al. (1993) as the difference between the dereddened
C0(41-42) and the standard value of this index corresponding to a star
with the same temperature and surface gravity, but not with the same
C0(42-45) and C0(45-48) as the star in question. Column (3) of Table 5
lists the cyanogen anomaly obtained for nine cluster giants. No value
could be determined for stars #59, 179 and 219 which fall outside the range of
Piatti et al. (1993) calibration.
The mean cyanogen anomaly is <> = -0.035 0.007 (m.e.), the
negative sign indicating a weak cyanogen band compared with the mean for
solar neigbourhood K giants. The cluster metallicity derived from the [Fe/H]
versus relation given by Piatti et al. (1993) is then [Fe/H] =
-0.29 0.10. We note that the DDO abundance derived for star #184
([Fe/H] = -0.3) suggests again that this is a cluster giant.
 a Not observed in the DDO system. b Outside the range of the DDO calibration. c Outside the range of the Washington calibration. |
We also examine the cluster abundance by determining the ultraviolet
excesses  (U-B) with respect to the field K giants. These quantities
were derived using Janes's (1979) Eq. (7) and comparing the (U-B)0
and (B-V)0 intrinsic colours of the cluster giants with the standard class
III two-colour line of Fitzgerald (1970) (see Fig. 2). The
derived UV
excesses are then directly comparable to , which is also based on
typical field stars. The computed (U-B) excesses are given in
Table 5. The mean value <
(U-B) with respect to the field K giants. These quantities
were derived using Janes's (1979) Eq. (7) and comparing the (U-B)0
and (B-V)0 intrinsic colours of the cluster giants with the standard class
III two-colour line of Fitzgerald (1970) (see Fig. 2). The
derived UV
excesses are then directly comparable to , which is also based on
typical field stars. The computed (U-B) excesses are given in
Table 5. The mean value < >
= -0.03 0.01 (m.e.) derived from 10 cluster giants implies [Fe/H] -0.3,
if Janes's (1979) Eq. (8) and Janes's (1975) Eq.
(2) are used. We note that this value practically does not change if the three
spectroscopic binaries #113, 179 and 269 are omitted. The resulting metallicity
is then in excellent agreement with that found
from the DDO data. Therefore, both and (U-B) values
support the conclusion that NGC2354 is a moderately metal-poor open cluster.
>
= -0.03 0.01 (m.e.) derived from 10 cluster giants implies [Fe/H] -0.3,
if Janes's (1979) Eq. (8) and Janes's (1975) Eq.
(2) are used. We note that this value practically does not change if the three
spectroscopic binaries #113, 179 and 269 are omitted. The resulting metallicity
is then in excellent agreement with that found
from the DDO data. Therefore, both and (U-B) values
support the conclusion that NGC2354 is a moderately metal-poor open cluster.
 ,
,  and
and
 relations. The
abundance-sensitive index
relations. The
abundance-sensitive index  is the difference between the observed
colour and the solar-abundance colour at the observed (T1-T2) [or
(M-T2)], where all colours refer to dereddened values. Geisler et al.
(1991) described a method for correcting the decrease in abundance
sensitivity with temperature and established new empirical calibrations of
the abundance indices
is the difference between the observed
colour and the solar-abundance colour at the observed (T1-T2) [or
(M-T2)], where all colours refer to dereddened values. Geisler et al.
(1991) described a method for correcting the decrease in abundance
sensitivity with temperature and established new empirical calibrations of
the abundance indices  with [Fe/H], where
refer respectively to
with [Fe/H], where
refer respectively to
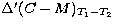 ,
, 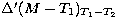 ,
,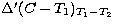 ,
,  and
and
 . These
  indices can be calculated from
the indices using Eq. (2) of Geisler et al. (1991). The derived
Washington abundance indices for NGC2354 giants are given in Cols.
(4)-(8) of Table 5. Stars #184 and 200 fall outside the range of the Washington
calibration. The resulting mean values and standard deviations of
the mean from ten cluster giants are:
indices can be calculated from
the indices using Eq. (2) of Geisler et al. (1991). The derived
Washington abundance indices for NGC2354 giants are given in Cols.
(4)-(8) of Table 5. Stars #184 and 200 fall outside the range of the Washington
calibration. The resulting mean values and standard deviations of
the mean from ten cluster giants are:
< > = <> = -0.14 0.03,
< > = <> = -0.04 0.01,
< > = <> = -0.18 0.03,
< > = <> = -0.09 0.02,
< > = <> = -0.10 0.02.
These values practically do not change if the three spectroscopic binaries
#113, 179 and 269 are omitted. Using the abundance calibration of
Geisler et al. (1991), the above mean
indices yield [Fe/H]1 = -0.37 0.06, [Fe/H]2 = -0.33 0.06,
[Fe/H]3 = -0.37 0.06, [Fe/H]4 = -0.32 0.07 and [Fe/H]5 =
-0.32 0.07. The average of the five Washington abundance estimates,
[Fe/H] = -0.34 0.02 (s.d.), is in very good agreement with the values derived
from both the DDO data and the UV excesses.
NGC2354 is therefore on the metal-poor side of the distribution of the intermediate-age
open clusters. Since this cluster is located about 1.4 kpc from the Sun at
l = 238 , its adopted metallicity ([Fe/H] = -0.30) is consistent with the
existence of a radial metallicity gradient in the Galactic disk (see, e.g.,
Janes 1979; Piatti et al. 1995).
, its adopted metallicity ([Fe/H] = -0.30) is consistent with the
existence of a radial metallicity gradient in the Galactic disk (see, e.g.,
Janes 1979; Piatti et al. 1995).
Copyright The European Southern Observatory (ESO)