Up: ISOCAM data processing
Subsections
One has to subtract the dark current from the image,
for both the SW and LW channels. This is done with measurements obtained
during dedicated calibration orbits. This procedure produces
acceptable results for the SW channel, but can sometimes fail for the
LW channel. The reason for this is a combination of long-term drifts in the
dark current, and low-signal that will make these drifts dominate the
noise over photon and readout noise. This situation is quite easy to
recognize as the LW dark current shows strong odd-even stripes (see
Fig. 4), which are not completely gone when the dark
correction fails. To provide the reader with orders of magnitudes for
these effects, Table 1 lists, for all integration times,
the spatial mean of the noise on the calibration dark measurement
(each dark is the result of the average of a given number of frames,
therefore each pixel in the dark measurement has an associated RMS,
we report here the mean of these RMS), and, separately
for the even and odd lines, the mean, median and rms of the dark
level. Finally, this table also lists typical values of residuals (mean
and rms) that can be obtained when the calibration dark is used (see
also Table 2). These values were obtained by correcting
very long dark measurements by the calibration dark. These long
measurements are performed to derive the time behavior of ISOCAM LW
dark (Biviano et al. 1998). As can be seen from the table, the dark
correction is not perfect and there remains a residual whose amplitude
is larger than the noise in the calibration dark. Furthermore a clear
even-odd pattern remains (see Fig. 4) as indicated by
the relatively large dispersion.
The offset between the calibration dark and the actual dark can only
be derived from a study of the time behavior of the dark (Biviano et al. 1998). The pattern, however, can be removed with appropriate
analysis (e.g. Van Buren & Aussel 1996; Starck & Pantin 1996).
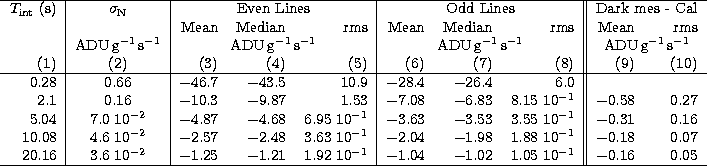
Table 1:
Dark levels and associated dispersions for the LW channel of
ISOCAM. Column (1) is the integration time in seconds, (2) is the
spatial mean of the noise (1 ) in the calibration dark
measurement. As the LW dark shows a strong separation between the odd
and even lines (due to the different amplification chains), we have
listed the levels separately for the even and odd lines.
The mean dark value, the median dark value, and the
1 dispersion around the mean are listed for the even lines
(Cols. 3 to 5) and odd lines (Cols. 6 to 8).
Finally in the last two columns,
we have used data obtained during "dark'' revolutions (CAM is kept
closed for a whole revolution and is continuously read out) to
exemplify the amplitude of dark drifts by subtracting the calibration
dark from these dark measurements. The spatial mean and rms are listed
in Cols. (9) and (10). All dark values are in
ADUg-1s-1. No values are listed for the 0.28 s
integration time since due to technical constraints, it cannot be measured
for a complete orbit
) in the calibration dark
measurement. As the LW dark shows a strong separation between the odd
and even lines (due to the different amplification chains), we have
listed the levels separately for the even and odd lines.
The mean dark value, the median dark value, and the
1 dispersion around the mean are listed for the even lines
(Cols. 3 to 5) and odd lines (Cols. 6 to 8).
Finally in the last two columns,
we have used data obtained during "dark'' revolutions (CAM is kept
closed for a whole revolution and is continuously read out) to
exemplify the amplitude of dark drifts by subtracting the calibration
dark from these dark measurements. The spatial mean and rms are listed
in Cols. (9) and (10). All dark values are in
ADUg-1s-1. No values are listed for the 0.28 s
integration time since due to technical constraints, it cannot be measured
for a complete orbit
|
|
 |
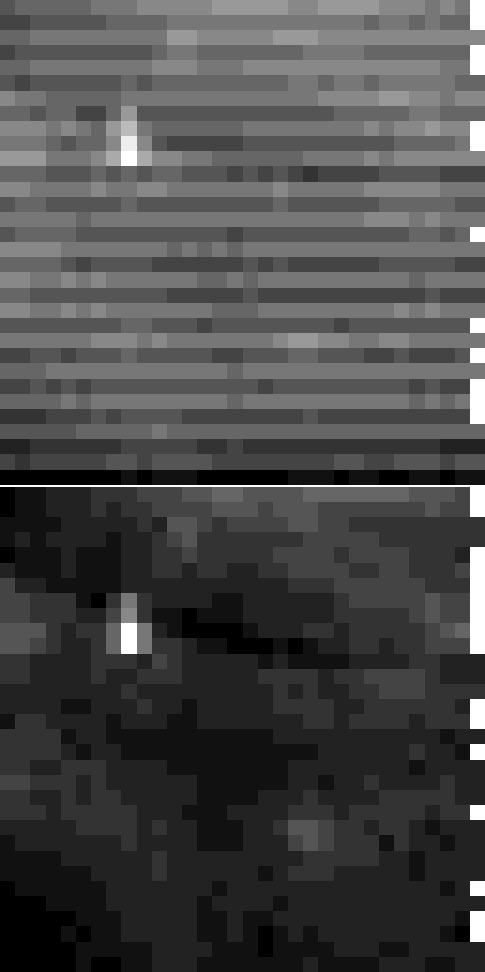
Figure 4:
Image before dark subtraction (left) and after (right). Notice
the dark pattern, which is visible as a change of the signal by comparing
odd and even lines in the original image |
In order to extract the residual dark from the data, we first derive
the median image M(x,y) by taking the median of all values
Image(x,y,*) for a given detector pixel. If the pixel (x,y) sees
the background longer than an object, then M(x,y) (renormalized)
gives a good estimate of the flat-field at this position. In a
general way, M(x,y) contains less signal than I(x,y,c) for any
configuration c, and we prefer to try to extract the residual dark
in M than in I.
Filtering can be applied to M to suppress the visual residual
dark. In order to achieve this without modifying the signal significantly,
we use the vertical cross-entropy of image O(x,y) defined
by
| 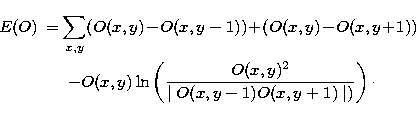 |
|
| (3) |
This entropy definition leads to a solution where the difference between pixels
in one direction is minimized while matching the data
as closely as possible.
The functional to minimize is:
| 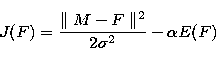 |
(4) |
in which the first term ( ) represents the "goodness of fit" (GOF)
constraint, which is regularized by the vertical cross-entropy
functional E(F). is the noise standard deviation, and
) represents the "goodness of fit" (GOF)
constraint, which is regularized by the vertical cross-entropy
functional E(F). is the noise standard deviation, and
 a parameter defining the weight between the GOF term and the
regularizing efficiency by the cross-entropy. F is the filtered
image.
a parameter defining the weight between the GOF term and the
regularizing efficiency by the cross-entropy. F is the filtered
image.
The gradient of the former functional is
| 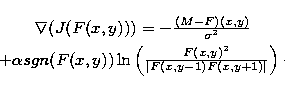 |
|
| (5) |
Then the "one step gradient'' algorithm gives us an iterative scheme
to minimize the functional (4):
| 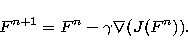 |
(6) |
The residual dark is finally obtained by taking the difference between
M and F.
The dark pattern can be suppressed in Fourier space by the
following method:
- 1.
- Average together all deglitched frames, obtaining
 .
. - 2.
- Eliminate in the low frequencies, obtaining
 .
. - 3.
- Estimate the noise in , and set to zero all structures
higher than three times the noise standard deviation.
- 4.
- Compute the FFT
 of , and estimate the noise
in the real part
of , and estimate the noise
in the real part  , and imaginary part
  of .
of . - 5.
- Threshold all Fourier coefficients lower than the noise.
We get
 ,
,  .
. - 6.
- Compute the inverse FFT transform of
 ,
,  . Its real part gives the
pattern P. The pattern P can then be subtracted from the input image.
. Its real part gives the
pattern P. The pattern P can then be subtracted from the input image.
This procedure can be iterated and usually three cycles is
sufficient for a good dark pattern removal.
The residual dark can be relatively well suppressed just by deleting
some frequencies. The result is obviously not as good as if we had had
the true dark, and there will be always a confidence interval on the
flux. Yet the advantage of the FFT thresholding method is that it
always finds a residual dark image evaluation with zero
mean (whithin the numerical errors). Therefore, the method just suppresses the visual artifacts,
without adding any offset to the data. The MEM method produces good
results as well, but seems to have some limitations. For instance, it
is a real filtering method (even if it is only in one direction), thus, the
noise statistics can be modified. This point could be resolved by
previous filtering of the data cube. Note, also, that some columns
can show atypical behavior and the resulting artifacts seem to be
satisfactorily removed when using the FFT thresholding method.
Figure 5 shows the final calibrated raster image
of the Antennae, without any second order dark correction (upper), and
with a second order dark correction using the FFT method (lower). The
visual aspect of the residual dark has disappeared. It must be clear
that the "real'' dark is not corrected using this method, only its
visual aspect is removed.
To provide quantitative information on the quality of this correction
we performed the following experiment: we used dark measurements
performed during "dark orbits'' (see Biviano et al. 1998) and
subtracted the corresponding calibration dark
from these measurement.
The FFT method was applied to the
residuals. In Table 2 we give, for the most often used
integration times of 2.1, 5.04 and 10.08s, the mean and rms around
the mean for the residuals after calibration dark removal, the mean
and rms around the mean for the residuals after the FFT dark
correction. As can be seen from the table, the mean value of the
residuals is almost unchanged after the FFT dark correction while the
rms has been divided by two. More striking is the effect in
even-odd pattern. In the last two columns of Table 2 we
list the difference between the mean of the even lines and the mean of
the odd lines for the residuals after calibration dark correction and
those after application of the FFT dark correction. After FFT dark
correction the remaining difference becomes barely significant.
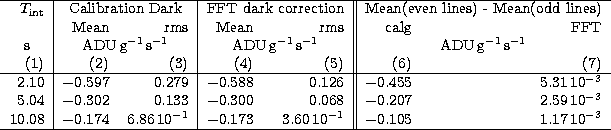
Table 2:
Quantitative information on the performances of the FFT dark
subtraction method. This table compares the quality of dark current
correction between the standard method, i.e. using a library dark, and
the standard+FFT method, where the subtraction of a library dark is
followed by FFT filtering. To make this comparison, we are using dark
measurements (typically between 10 and 20 per integration times)
obtained during "dark'' orbits (Biviano et al. 1998). Column (1)
gives the integration time in seconds. We only display results for the
most commonly used integration times. Columns (2) and (3) list the spatial
mean and rms on the library dark corrected images. Columns (4) and (5)
give the same information once these images have been FFT
filtered. One can see that the mean signal is little affected (<2%)
while the rms is divided by  2. In Cols. (6) and (7) we compare
the even and odd lines of the images at the two stages of dark
correction by computing the difference between the mean of the even
lines and the mean of the odd lines. One can see that while this
difference is quite significant after only the library dark
correction, it is almost insignificant after FFT filtering
2. In Cols. (6) and (7) we compare
the even and odd lines of the images at the two stages of dark
correction by computing the difference between the mean of the even
lines and the mean of the odd lines. One can see that while this
difference is quite significant after only the library dark
correction, it is almost insignificant after FFT filtering
|
|
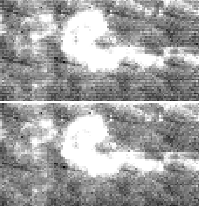 |
Figure 5:
Upper, raster image of the antennae without second order dark
correction, and lower, the same image but using the FFT thresholding
second order dark correction |
Up: ISOCAM data processing
Copyright The European Southern Observatory (ESO)