
Up: The Arcetri spectral code
The Arcetri spectral code and database for the evaluation of
hot plasmas emissivity has been revised and now includes:
- The whole CHIANTI dataset concerning the atomic models, the
electron collision excitation and radiative decay rates for most of the
ions of C, N, O,
Ne, Mg, Al, Si, S, Ar, Ca, and iron FeII and from FeVII to FeXXIV
- Atomic data for the so-called minor elements (Na, P, Cl, K,
Ti, Cr, Mn, Co and Zn) and for Al V, VI, VII, VIII not yet
included in the CHIANTI database. The ions of these elements may provide
several observed lines which can prove useful in spectral analysis and DEM studies,
although some of which are weak in most spectra.
The minor elements Database includes ions belonging to the
Li-like, Be-like, B-like, F-like, C-like, N-like, O-like, Na-like,
Mg-like isoelectronic sequences.
For most sequences, theoretical computation available in the literature
has been used; no collision data are available for
the Magnesium- , Oxygen- and Nitrogen-like minor elements, so it has been necessary to interpolate the effective collision strengths and the radiative data
from the isoelectronic ions which were available in the CHIANTI
database.
- Fe III atomic model, collisional and radiative dataset.
- Atomic data for the lines in the range 1 - 2000 Å not included
neither in CHIANTI nor in the minor elements dataset; they have been
renewed updating
the
transition probabilities from the literature.
Line emission in this case is evaluated assuming collisional population
from ground level only.
- Continuum emission including, free-free, free-bound
from all the ions in the database, and two-photon continuum from H-like
and He-like ions.
The assessment of the atomic data for the minor elements is
discussed in detail and comparison with results of the old version
for the most abundant elements is performed.
Most important lines results to have been correctly evaluated also in
the old version, but a number of very large differences occurred, due to
the use of improved values of the collision excitation rates.
Random comparison have been performed with
the Utrecht code (Kaastra et al. 1996) using the line list available
at the
SRON-SPEX (Spectral X-Ray and UV modeling, analysis and fitting)
World Wide Web page at http://saturn.sron.ruu.nl/general/projects/spex/
Most results agree within 50% but a number of big differences have
been shown and a more detailed comparison will be performed in the
future.
The present version of the Arcetri code, is being currently applied
to the spectroscopical diagnostic of CDS data from SOHO,
Fig. 2 and Fig. 3
to the line identification of SERTS Fig. 4
and to the
analysis of EUVE observations of stellar coronae from solar-type stars,
Fig. 6 and Fig. 5.
Work is in progress to apply the code to the data analysis of SAX
observations of active stars.
![\begin{figure}
\includegraphics [angle=90,width=8cm]{fig2a.eps}
\epsfig {file=sp3nis1.ps,angle=90,width=8.0cm}\end{figure}](/articles/aas/full/1998/21/ds7531/Timg66.gif) |
Figure 2:
NIS1 spectrum of a solar active region.
The normal incidence spectrograph observation from SOHO of an active
region (top) is compared with the simulated synthetic spectrum
(bottom); use is made of the Arcetri spectral database; the
electron density  is assumed is assumed |
 |
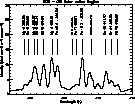
Figure 3:
New lines included in the code.
The grazing incidence spectrum of a solar active region from 397 Å to
415 Å. Data from CDS on SOHO. The clearly identified NaVIII 411.17
and CrXIV 412.05 are among the new lines included in the minor elements
database. The spectrum has been convoluted with a Gaussian in order to remove fixed
patterning |
 |
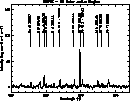
Figure 4:
The SERTS-89 line identification.
The section between 380 Å and 397 Å of the spectrum of the SERTS-89
flight (Thomas & Neupert 1994). The lines of Mn XV, Ti XI, and Cr XIV are among the new
ones included in the database |
![\begin{figure}
\includegraphics [height=12cm]{7531f5.eps}\end{figure}](/articles/aas/full/1998/21/ds7531/Timg70.gif) |
Figure 5:
The EUVE spectrum of  .
The medium wavelength section of the extreme ultraviolet explorer
spectrum of .
The medium wavelength section of the extreme ultraviolet explorer
spectrum of  :
the
synthetic spectrum (top) is compared with the
observated one (bottom).
Several prominent lines are labeled with their identifications :
the
synthetic spectrum (top) is compared with the
observated one (bottom).
Several prominent lines are labeled with their identifications |
 |
Figure 6:
The EUVE spectrum of kappa Ceti.
The long wavelength section of the Extreme Ultraviolet Explorer
spectrum of kappa Ceti a solar-type star:
the
synthetic spectrum (top)
the observation (middle), the signal-to-noise ratio (bottom).
 marks features having signal-to-noise ratio larger than 2 and smallerthan 3 marks features having signal-to-noise ratio larger than 2 and smallerthan 3 |


Up: The Arcetri spectral code
Copyright The European Southern Observatory (ESO)