Firstly let us note that both in 1993/94 and 1994/95 the spectra of variable components are well fitted by power law. This result and the existence of high optical polarization (Efimov & Shakhovskoy 1996) point to their synchrotron nature.
As was mentioned above, in all three seasons the spectral index in optical region was nearly the same irrespective of a flux level. This indicates that the variability wasn't accompanied by changes of energy spectrum of relativistic electrons. Under these circumstances the variability is more probably explained by the variation of the amount of relativistic electrons in the source (Hagen-Thorn et al. 1992). As for flattening the spectrum in the IR over the flare, Hagen-Thorn et al. (1994) supposed that such effect might be due to synchrotron self-absorption. Let us note the lack of 1994 flare at cm-wavelengths certainly due to self- absorption (Marscher 1997).
Up to now the analysis of colour behaviour of OJ 287 was performed for three large outbursts (Hagen-Thorn 1987; Hagen-Thorn et al. 1991,1994; this paper). These outbursts (1971, 1983, 1994) are well seen in master light curve of OJ 287 given by Sillanpää et al. (1996a). It is interesting to compare the results for all three outbursts.
For the outburst
of 1971 only U, B, V data are available, but the outburst of
1983 was studied in more detail. In all three events the
variable source is shown to have variable flux but unchanged
spectral energy distribution in optical UV region. For 1971
outburst only the colour indices of variable component
![]() were found, but in the outbursts of
1983 and 1994 the relative spectral energy distributions in wide
spectral range from IR to UV were constructed. In the last two
outbursts the relative spectral energy distributions are well
represented by the spectrum of synchrotron source; the colour
indices of variable source in 1971 outburst also pointed to
its synchrotron nature.
were found, but in the outbursts of
1983 and 1994 the relative spectral energy distributions in wide
spectral range from IR to UV were constructed. In the last two
outbursts the relative spectral energy distributions are well
represented by the spectrum of synchrotron source; the colour
indices of variable source in 1971 outburst also pointed to
its synchrotron nature.
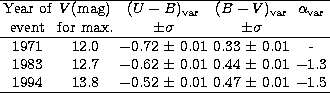
The data for all three events are given in Table 4 which contains the maximum brightness in V band in the outburst (Sillanpää et al. 1996a) as well as the colour indices and spectral index in optical region for the variable component.
The examination of Table 4 shows that there is a clear correlation between the maximum brightness in event and colour properties of the variable component. The larger is the outburst the bluer is the variable source. Hence in stronger outburst the energy spectrum of relativistic electrons in the source is flatter.
Let us compare the data for 1983 and 1994 outbursts in more detail. The outbursts show many identical features. In both cases the spectra are rectilinear up to lowest frequencies out of the flare while in the flare they are curved in the IR. Because in the optical region the spectral index within the outburst is the same irrespective of flux level (i.e. the energy distribution of relativistic electrons does not change) one must search for another reason of IR spectrum flattening in the flare. Pacholczyk (1977) points to several such possibilities for synchrotron source. The synchrotron self-absorption is the most alluring because the variability is probably connected with the variations of the amount of relativistic electrons in the source and during the flare the density of electrons in the source should be very high.
But there is a difficulty connected with the fact that usually the flux maximum lies at short centimeter wavelengths. In our case we don't reach the maximum but probably it lies in the region of tens of micrometers. The difference is about 2.5 order of magnitude. Though optical-IR source is much smaller than radio one (as shows the time-scale of variability) and located more close to the jet origin where the magnetic field is higher it is not clear whether this is sufficient to shift the flux maximum to IR wavelengths. May be another reason (e.g. a shift to higher energy of the low-energetic cutoff in energy spectrum of relativistic electrons) should be found.
At the same time there are some differences in spectral energy
distribution of synchrotron sources in 1983 and 1994. Besides
the difference in spectral slope, the former spectrum clearly
demonstrates the high-frequency cutoff (Hagen-Thorn et al. 1994)
while the latter one does not. This means that there is a distinction
between values of critical frequency depending on maximum energy
in the energy distribution of electron and magnetic field
strength. Unfortunately, the data don't allow to determine
exactly the reason of this distinction.
Copyright The European Southern Observatory (ESO)