Up: Calculated oscillator strengths of cobalt
Subsections
To calculate the (3d8+3d74s)  3d74p transitions in Co II
properly, it is necessary to take several neighbouring configurations
into account: we used
(3d8+3d74s+3d64s2+3d74d+3d75s) for the even and
(3d74p+3d64s4p+3d54s24p+3d75p+3d74f) for the odd system.
Interactions with other (far-lying) configurations are taken into account by means
of so-called effective operators. The overall mean deviations are 39 cm-1 for the even system
and 19 cm-1 for the odd system. The mean deviations for the individual lower configurations
are 1.4, 7.1 and 15 cm-1 for 3d8, 3d74s and 3d74p, respectively.
In Table 2 the log(gf) values for the (3d8+3d74s)
3d74p electric dipole (E1) transitions are given.
This system is selected by cutting off energy values higher than
120000 cm-1 of both the even and the odd system in the final printing procedure;
only log(gf) values larger than -3 are included. In this paper a sample
focusing on the resonance lines is given, as these UV lines are of most interest in ISM
absorption observations; as explained in a footnote to the abstract,
the complete table can be obtained at CDS.
3d74p transitions in Co II
properly, it is necessary to take several neighbouring configurations
into account: we used
(3d8+3d74s+3d64s2+3d74d+3d75s) for the even and
(3d74p+3d64s4p+3d54s24p+3d75p+3d74f) for the odd system.
Interactions with other (far-lying) configurations are taken into account by means
of so-called effective operators. The overall mean deviations are 39 cm-1 for the even system
and 19 cm-1 for the odd system. The mean deviations for the individual lower configurations
are 1.4, 7.1 and 15 cm-1 for 3d8, 3d74s and 3d74p, respectively.
In Table 2 the log(gf) values for the (3d8+3d74s)
3d74p electric dipole (E1) transitions are given.
This system is selected by cutting off energy values higher than
120000 cm-1 of both the even and the odd system in the final printing procedure;
only log(gf) values larger than -3 are included. In this paper a sample
focusing on the resonance lines is given, as these UV lines are of most interest in ISM
absorption observations; as explained in a footnote to the abstract,
the complete table can be obtained at CDS.
The first column of this table shows the wavelength obtained
from the energy differences between the experimental level values.
Wavelengths below 2000 Å are given as vacuum wavelengths and
above 2000 Å as air wavelengths. The second column
gives the log(gf) values followed by the J-value, energy value and the
name of the lower (even) level. The first character of the
level name designates the configuration number: for the even levels
"1" refers to 3d8 and "2" to 3d74s; for the odd levels "1"
refers to 3d74p.
An "*" after the energy
value indicates that the level is known, in which case
the experimental level value is given. When unknown, the calculated
energy value is given and used to approximate the wavelength.
Full results including weaker lines and lines involving higher lying
levels can be found on Internet.
To have an indication of the accuracy, we compare our results with data
from three different experiments as well as with the calculations from the
well known database of Kurucz (Kurucz 1993).
- First of all, we compare in Table 3 Kurucz's and our
log(gf) values with the results of a recent "state of the art" experiment
to determine absolute oscillator strengths (Mullman et al.
1997). It can be seen that the present results are always close
to the experimental ones, and 16 out of 28 can be considered "equal" to
within the uncertainties specified.
- In Table 4, we make a comparison with the intensity
numbers obtained by the recent FTS experiment (Pickering et al.
1997). The intensity numbers given by Pickering et al. are
signal-to-noise ratios of the lines of the FT spectra. These values are
useful in the comparison of one line to another; however, they do not show
absolute intensities. All transitions considered are based on the lowest
even term, the 3d8 (32F). The order of our log(gf) values
completely agrees with the order of experimental intensity numbers, and
confirms the present approach.
- In the region 2300 to 2800 Å a number of 3d74s-3d74p
transition probabilities can be compared with measured oscillator strengths
of the 28 strongest lines in the multiplets UV7, UV8 and UV9 published in
1985 (Salih et al. 1985). With respect to earlier work
of Kurucz (Kurucz & Peytremann 1975), Salih et al.
observe good agreement for strong lines but less so for intercombination
(
 ) lines. At this point we would like to emphasize that the
agreement with the current data of Kurucz's database (Kurucz
1993, semi-empirical Fe-group) is much better. The present method
is not inherently different, except that use of orthogonal operators
stabilizes the fit and allows the introduction of higher order effects into
the model. As a result the eigenvector compositions should be more
reliable, which is most obvious in intercombination lines. From
Table 5 it seems that our calculated log(gf) values agree
somewhat better for
) lines. At this point we would like to emphasize that the
agreement with the current data of Kurucz's database (Kurucz
1993, semi-empirical Fe-group) is much better. The present method
is not inherently different, except that use of orthogonal operators
stabilizes the fit and allows the introduction of higher order effects into
the model. As a result the eigenvector compositions should be more
reliable, which is most obvious in intercombination lines. From
Table 5 it seems that our calculated log(gf) values agree
somewhat better for  also.
also.
In general, the current data turn out to prevail in all three cases.
Table 2:
Calculated log(gf) values for the (3d8+3d74s) - 3d74p
transition array of Co II
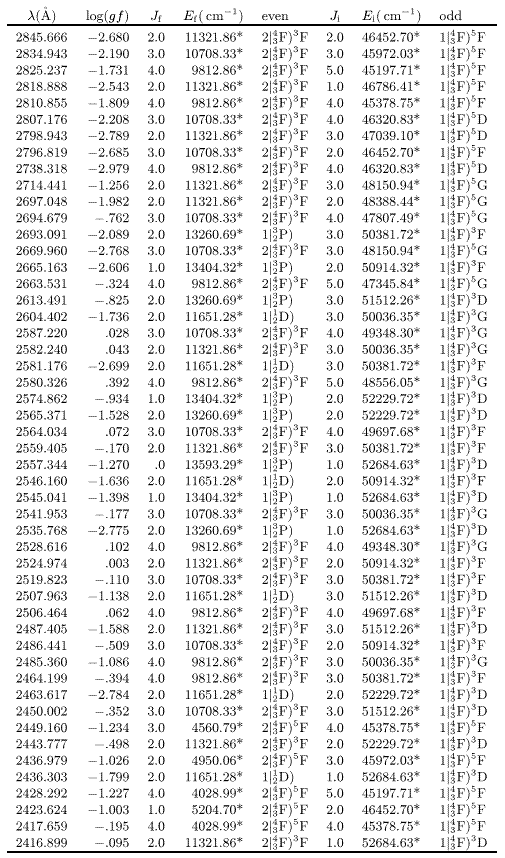 |
Table 2:
continued
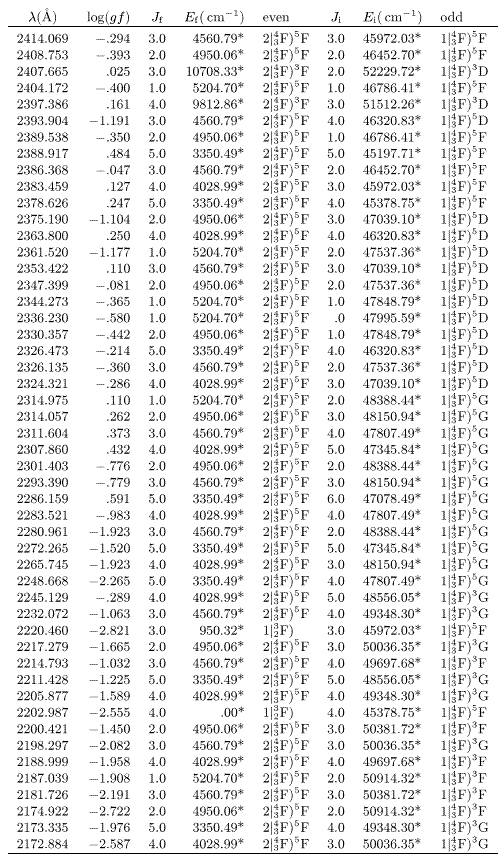 |
Table 2:
continued
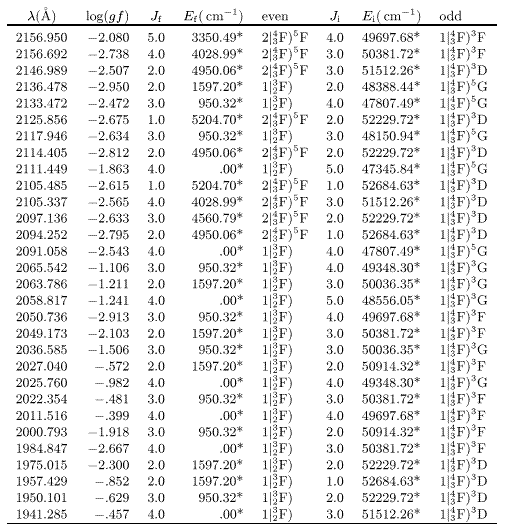 |
Table 3:
Comparison between theory and experimenta of log(gf)-values for the (3d8+3d74s) 3d74p
transitions involving the lowest even multiplets
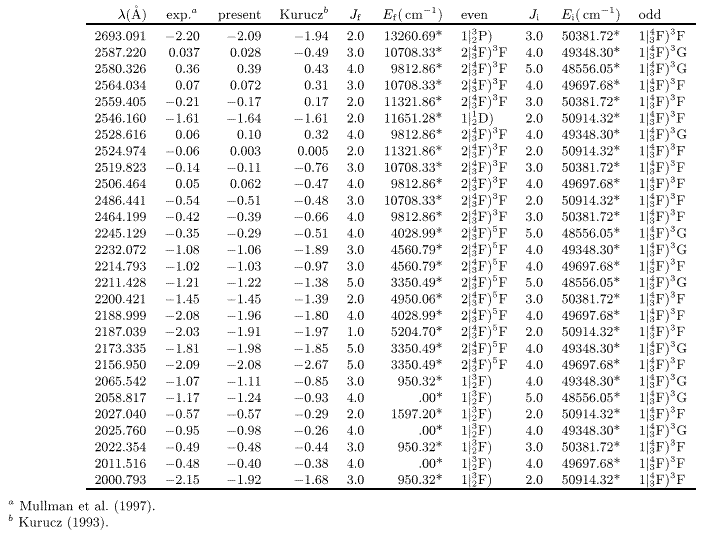 |
Table 4:
Comparison between experimentala intensity numbers and theoretical log(gf)-values
for the 3d8 - 3d74p
transitions involving the ground 32F term
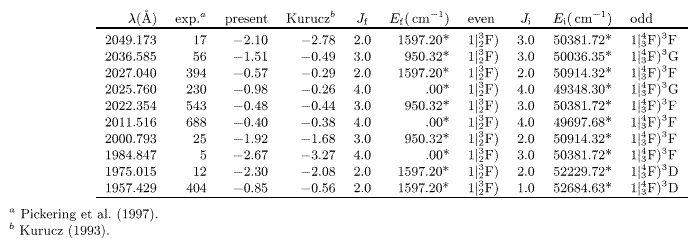 |
Table 5:
Comparison between theory and experimenta of log(gf)-values for the
3d74s - 3d74p
transitions involving the lower 3,5F multiplets
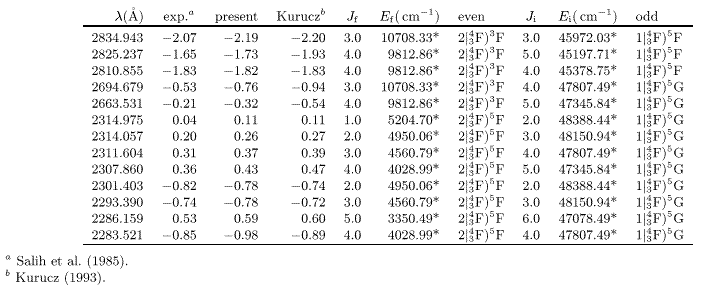 |
Table 6:
Values for the electric quadrupole transition integrals
in Co II calculated by means of MCDF including core polarization
|
|
Table 7:
Calculated A-values for the (3d8+3d74s) - (3d8+3d74s)
M1 and E2 transition arrays of Co II; the notation x(y) means

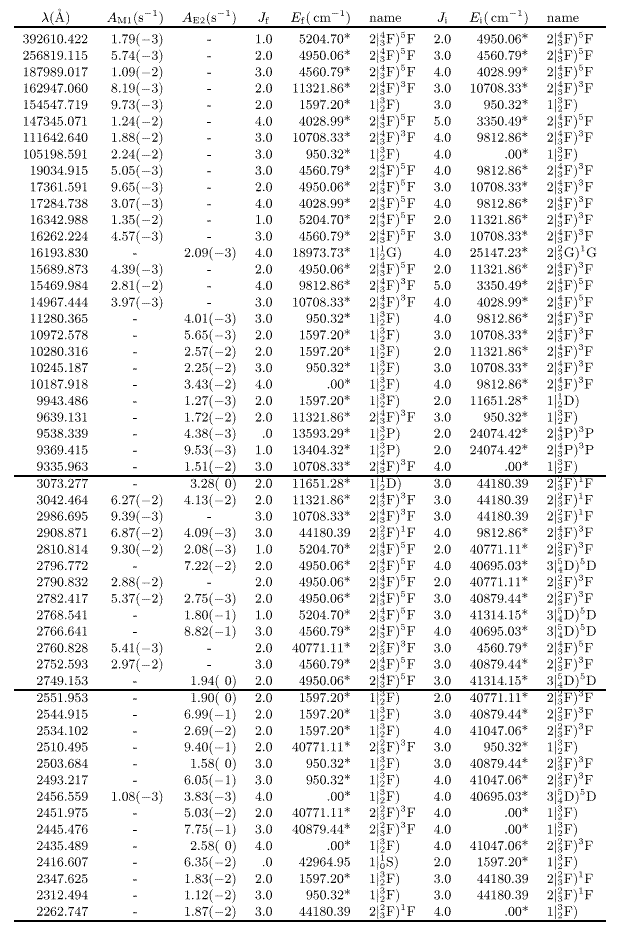 |
Transition probabilities of forbidden, i.e. magnetic dipole (M1) or electric
quadrupole (E2), transitions are only given for energy levels below 50000
cm-1 in view of their astrophysical relevance.
The forbidden transitions observed in the infra-red
at 18.8  m, 10.52 m and 1.547 m
by Jennings et al. (1993), are all M1 transitions. In
their interpretation, Jennings et al. used a calculation of
Nussbaumer & Storey (1988), with A-values 1.08, 2.23
and 2.89
m, 10.52 m and 1.547 m
by Jennings et al. (1993), are all M1 transitions. In
their interpretation, Jennings et al. used a calculation of
Nussbaumer & Storey (1988), with A-values 1.08, 2.23
and 2.89  s-1. These values agree with ours at the percent level (in
Table 7, we give 1.09, 2.24 and 2.81 s-1), which is not
very surprising as it concerns here strong transitions based on relatively
pure levels; moreover, no radial transition integrals are needed for M1
transitions. For the (a3F-b3F) E2 transitions given by Nussbaumer
& Storey the discrepancies are larger, our values being roughly 20% lower.
For levels that are less pure, the present method is expected to be
especially effective. Radiative data for infrared lines arising from
forbidden transitions are needed to study the debris of Type II supernova
explosions like SN 1987 A (Li et al. 1993).
s-1. These values agree with ours at the percent level (in
Table 7, we give 1.09, 2.24 and 2.81 s-1), which is not
very surprising as it concerns here strong transitions based on relatively
pure levels; moreover, no radial transition integrals are needed for M1
transitions. For the (a3F-b3F) E2 transitions given by Nussbaumer
& Storey the discrepancies are larger, our values being roughly 20% lower.
For levels that are less pure, the present method is expected to be
especially effective. Radiative data for infrared lines arising from
forbidden transitions are needed to study the debris of Type II supernova
explosions like SN 1987 A (Li et al. 1993).
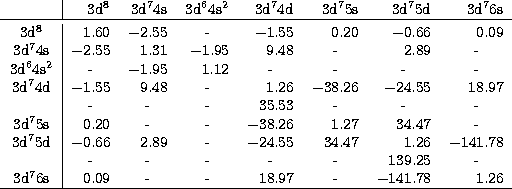
Similar to the E1 case, the radial part of the E2 transitions is
calculated from relativistic wavefunctions. In Table 6
the radial integrals for the electric quadrupole transitions are given in the form
of a symmetric matrix.
For E2-transitions within the 3d74d configuration,
there are two non-zero contributions, one for the 3d-3d and one for the
4d-4d transition. For this case, there are
two rows in the table, the upper for the 3d-3d
integral and the lower for the 4d-4d transition integral.
The A-values for the forbidden lines are restricted
to the magnetic dipole (M1) and electric quadrupole (E2)
transitions within the 3d8+3d74s configurations,
from levels with an energy of less than 50000 cm-1 above the ground and
with A-values larger than 10-3 s-1. The level with the lower
J-value is given first in the designation of the transition. A specimen
of the table available at CDS is included in the paper as Table 7.
We selected data for this sample in three wavelength regions: the first
includes the observed infra-red transitions, the second illustrates a region
where M1 and E2 transitions occur simultaneously and the last gives
ultra-violet transitions involving the lowest configuration 3d8. As the
sample is necessarily incomplete, only the full CDS table should be used to
calculate radiative lifetimes.
Up: Calculated oscillator strengths of cobalt
Copyright The European Southern Observatory (ESO)