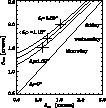

Up: Isokinetic patch measurements on
This seeing monitor has been tested on the nights of January 15,
16 and 17 at the Astrophysical Observatory of Asiago.
During the same night, the images of the edge of the Moon where collected
in two or more runs, separated by an amount of time greater than the
typical e-folding time of the atmospheric perturbations
(Racine 1996).
The results obtained from the collected data are summarized in
Table 2.
Table 2:
Measured values for the isokinetic patch and for the Fried
parameter during the three nights of the test.
The last two columns represent mean values for the same night
|
|
As previously explained with this experiment one can simultaneously
get both the value of the isokinetic angle,
 (in the third column) and of the Fried parameter, r0, (fourth
column) but the latter is not measured directly.
It is then possible, with the following equation,
to recover from r0 the value of the seeing,
here and in the following denoted as  ,
during the night of test (last column):
| ![\begin{displaymath}
\delta_{\rm sm} \approx 206265 \left({\lambda \over r_0}\right) \ \ {\rm [arcsec]},\end{displaymath}](/articles/aas/full/1998/12/ds1440/img36.gif) |
(7) |
It has not been possible to compare the results of the
experiment with other seeing monitors.
Nevertheless, during the same nights, astronomers at the Cima Ekar
Telescope in Asiago gave an estimate to the seeing from the FWHM of
the lines of the Echelle Spectrograph along the spatial scale.
A comparison with their estimates (Fig. 6) shows
consistency of the data obtained with this experiment,
provided that one sums quadratically a blurring effect  to the seeing measured with our seeing monitor,
  :
:
|  |
(8) |
The blurring term,  , includes both the effects of dome
seeing, of jittering and tracking and of the optical aberrations
of the 1.82 m telescope. Unfortunatly we could not measure directly
r0 with our seeing monitor and this is the only way we had to
compare our results with an independent estimation.
 |
Figure 6:
The seeing measured at the Echelle spectrograph of Cima Ekar
during the nights of the test is compared to the results obtained with
the seeing monitor. The difference observed can be ascribed to dome seeing |
A further relation has been searched using the data
collected during the experiment.
We said that one can partially ascribe
to dome seeing and to errors introduced by the telescope
the difference observed
between the seeing monitor and the Cima Ekar telescope.
The mean thermal gradient between the inside and the
outside of the dome at Cima Ekar, measured during the three nights of
the test, when compared to the difference in the seeing,  ,
approximatively follows a law of this kind:
|  |
(9) |
With three available points, one for each night, it is only
possible to show the proportionality between
 and
and  :
a comparison with other "seeing/temperature" relations,
as reported for example by Lowne (1979) and by
Bridgeland & Jenkins (1997),
shows that the data collected with this experiment may fall
in the range of values given by those authors.


Up: Isokinetic patch measurements on
Copyright The European Southern Observatory (ESO)


![]() (in the third column) and of the Fried parameter, r0, (fourth
column) but the latter is not measured directly.
(in the third column) and of the Fried parameter, r0, (fourth
column) but the latter is not measured directly.
![]() ,
during the night of test (last column):
,
during the night of test (last column):
![\begin{displaymath}
\delta_{\rm sm} \approx 206265 \left({\lambda \over r_0}\right) \ \ {\rm [arcsec]},\end{displaymath}](/articles/aas/full/1998/12/ds1440/img36.gif)

![]() ,
approximatively follows a law of this kind:
,
approximatively follows a law of this kind: