Although Lanz & Mathys (1991) found a 7.769 day period for the photometric variations of 49 Cancri (= HR 3465 = HD 74521 = BI Cancri), they noted that this period needs to be confirmed. They used 54 measurements in the Geneva system distributed over almost 20 years with most values from 1987-88. Previous studies had indicated periods of 4.24 d (Rakosch & Fielder 1974) and of 5.43 d (Stepien 1968). The largest amplitude found was about 0.03 mag.
There were 24 good sets of FCAPT uvby observations made in
1990-91, 11 in 1991-92, 4 in 1992-93, 26 in 1993-94, and 35 in 1994-95.
The amplitude of variability is 0.015 mag in v, 0.025 mag in
u and y, and 0.030 mag in b. A periodogram analysis
of the b magnitudes showed that the period was ![]() days.
When the V data of Lanz & Mathys (1991) are plotted with this period,
they show a single wave variation similar to the FCAPT data although a few
points exhibit considerable scatter. I used the u and b
light curves to define the zero phase as that of light curve
minimum. As I began with the
zero epoch of Catalano & Leone (1993), I found
days.
When the V data of Lanz & Mathys (1991) are plotted with this period,
they show a single wave variation similar to the FCAPT data although a few
points exhibit considerable scatter. I used the u and b
light curves to define the zero phase as that of light curve
minimum. As I began with the
zero epoch of Catalano & Leone (1993), I found ![]() .
The light curves (Fig. 3 (click here)) are asymmetric with the rise to
maximum taking longer than the fall to minimum. This was also
noted by Catalano & Leone who used the 7.769 d period. This
suggests that there are at least two spots present, one of which is
seen in the b and perhaps in the u photometry.
.
The light curves (Fig. 3 (click here)) are asymmetric with the rise to
maximum taking longer than the fall to minimum. This was also
noted by Catalano & Leone who used the 7.769 d period. This
suggests that there are at least two spots present, one of which is
seen in the b and perhaps in the u photometry.
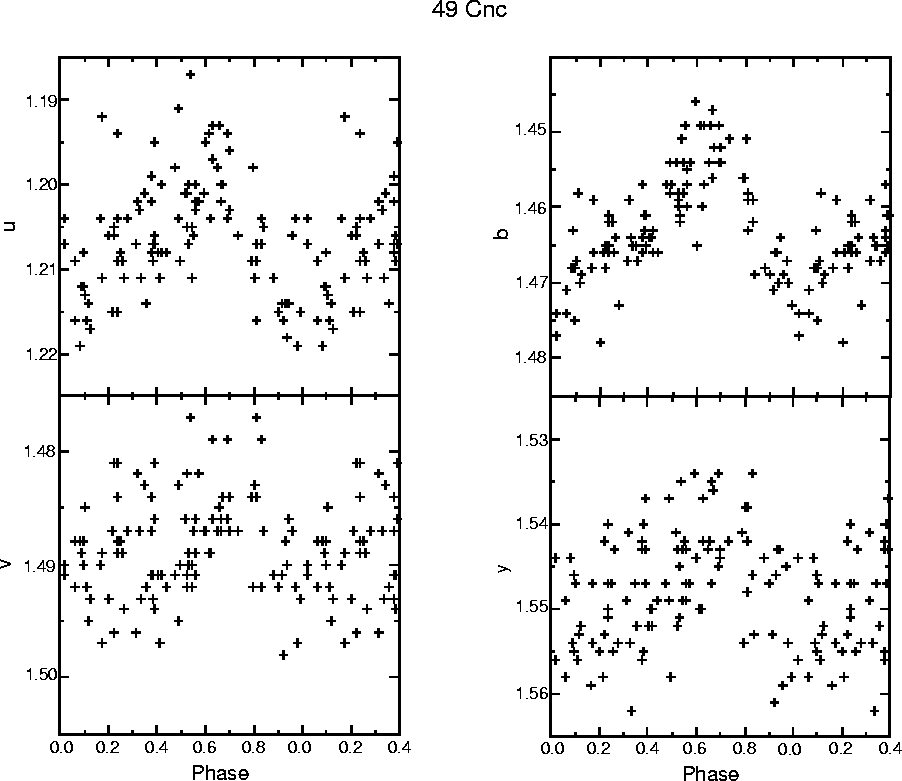
Figure 3: FCAPT photometry of the magnetic CP star 49 Cnc plotted with
this paper's ephemeris