Of our energy dependent collision strengths only those for the 18 transitions between n = 2 and n' = 2, 3 are perturbed by autoionising resonances. In some cases the resonances greatly increase the effective collision strengths. But in general this happens at temperatures below a million degrees so it is not of particular astrophysical significance since, as mentioned earlier, under conditions of coronal ionization equilibrium the abundance of Fe+23 is essentially zero at such "low" temperatures.
It would be tedious to discuss in detail the energy dependence of each of
the 39 collision strengths we have calculated. Here we select a few cases
which serve to illustrate the main features. For conciseness and convenience
we label the target energy levels nlj in ascending order with the index
shown in Table 2 (click here). This starts at 1 for the ground level (![]() ) and ends at 15 for the highest level (
) and ends at 15 for the highest level (![]() ).
).
Transitions ![]() and
and ![]() are optically allowed and, apart from
their numerical values, the collision strengths
are optically allowed and, apart from
their numerical values, the collision strengths ![]() and
and
![]() have almost identical resonance patterns.
Figure 1 (click here) shows
have almost identical resonance patterns.
Figure 1 (click here) shows ![]() from threshold up to the
energy of the
from threshold up to the
energy of the ![]() level. Note that we plot
level. Note that we plot ![]() against
the final electron energy Ef in Rydberg units. The initial energy
of the colliding electron E i relative to the the lower state is
given by E i = Ef + E if, where E if is the
transition energy and can be obtained from Table 2 (click here). At
against
the final electron energy Ef in Rydberg units. The initial energy
of the colliding electron E i relative to the the lower state is
given by E i = Ef + E if, where E if is the
transition energy and can be obtained from Table 2 (click here). At ![]() there is an indication in Fig. 1 (click here) of some structure in
the collision strength. Suspecting that this is caused by resonances
converging on the level
there is an indication in Fig. 1 (click here) of some structure in
the collision strength. Suspecting that this is caused by resonances
converging on the level ![]() , we give a blow-up in
Fig. 2 (click here) of the
, we give a blow-up in
Fig. 2 (click here) of the ![]() energy interval
energy interval
![]() ). Here we clearly see a number of narrow,
well separated resonances. A striking amount of detail, which is completely
hidden in Fig. 1 (click here), is now revealed. The apparently random way the
peaks of these small resonances vary is caused by not using a sufficiently
small steplength in energy for the purpose of scanning. To do so would
greatly increase the amount of computing time required and make the whole
calculation extremely arduous. The reason why resonances occur over less
than half the interval is because the search for them was stopped after a
finite number had been located.
Figure 3 (click here) shows
). Here we clearly see a number of narrow,
well separated resonances. A striking amount of detail, which is completely
hidden in Fig. 1 (click here), is now revealed. The apparently random way the
peaks of these small resonances vary is caused by not using a sufficiently
small steplength in energy for the purpose of scanning. To do so would
greatly increase the amount of computing time required and make the whole
calculation extremely arduous. The reason why resonances occur over less
than half the interval is because the search for them was stopped after a
finite number had been located.
Figure 3 (click here) shows ![]() as a function of temperature
over the interval
as a function of temperature
over the interval ![]() . One can see a slight
increase in
. One can see a slight
increase in ![]() for temperatures below about 106. This is due
to the resonances shown in Fig. 2 (click here); those at higher energies have a
much smaller effect on
for temperatures below about 106. This is due
to the resonances shown in Fig. 2 (click here); those at higher energies have a
much smaller effect on ![]() and produce a barely perceptible
increase at temperatures above 106.
and produce a barely perceptible
increase at temperatures above 106.
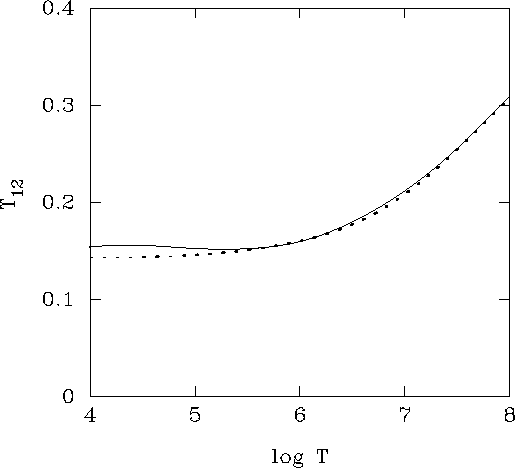
Figure 3: ![]() effective collision
strength for the temperature range
effective collision
strength for the temperature range ![]() .
Full line: IRON Project; broken line: Zhang et al.
(1990)
.
Full line: IRON Project; broken line: Zhang et al.
(1990)
The optically forbidden transition ![]() is a much more interesting case.
Here we cover the range from Ef = 0 to the
is a much more interesting case.
Here we cover the range from Ef = 0 to the ![]() level by
means of four separate plots in order to illustrate the varied structure
of the resonances. Figure 4 (click here) covers the range
level by
means of four separate plots in order to illustrate the varied structure
of the resonances. Figure 4 (click here) covers the range ![]() , which corresponds to the interval
, which corresponds to the interval ![]() . A thick forest of resonances is seen to occur here. A comparable
forest also occurs in Fig. 5 (click here) for the range
. A thick forest of resonances is seen to occur here. A comparable
forest also occurs in Fig. 5 (click here) for the range ![]() (interval
(interval ![]() ), while in
Fig. 6 (click here) for the range
), while in
Fig. 6 (click here) for the range ![]() (interval
(interval ![]() ),
the forest of resonances is preceded by a collection of isolated peaks.
Between the levels
),
the forest of resonances is preceded by a collection of isolated peaks.
Between the levels ![]() and
and ![]() there are
no resonances and no graph is shown. In Fig. 7 (click here), which covers
the interval
there are
no resonances and no graph is shown. In Fig. 7 (click here), which covers
the interval ![]() (
(![]() ), a striking
series of Rydberg resonances appears. The process of delineation was stopped
a short way from the
), a striking
series of Rydberg resonances appears. The process of delineation was stopped
a short way from the ![]() level after 5 groups of resonances had
been delineated. Figure 8 (click here) shows that after thermal averaging the
effect on
level after 5 groups of resonances had
been delineated. Figure 8 (click here) shows that after thermal averaging the
effect on ![]() of all those resonances is considerable
at temperatures below about one million degrees.
of all those resonances is considerable
at temperatures below about one million degrees.
Finally, the transition ![]() , namely
, namely ![]() ,
is the only case encountered where resonances have a really big effect (50%
increase above the background) at temperatures near ten million degrees,
see Fig. 9 (click here).
,
is the only case encountered where resonances have a really big effect (50%
increase above the background) at temperatures near ten million degrees,
see Fig. 9 (click here).
The dotted curves shown in all graphs of
![]() or
or ![]() represent the DW calculations by
Zhang et al. (1990). In order to make use of their tabulated
collision strengths we first fitted them by cubic splines using the program
OMEUPS (Burgess & Tully 1992). Each spline fit was then used
to generate a tableau of collision strength values for the purpose of
plotting. The same tableau was used to compute a thermally averaged
collision strength in order to make a graphical comparison with the present
IRON Project results.
represent the DW calculations by
Zhang et al. (1990). In order to make use of their tabulated
collision strengths we first fitted them by cubic splines using the program
OMEUPS (Burgess & Tully 1992). Each spline fit was then used
to generate a tableau of collision strength values for the purpose of
plotting. The same tableau was used to compute a thermally averaged
collision strength in order to make a graphical comparison with the present
IRON Project results.
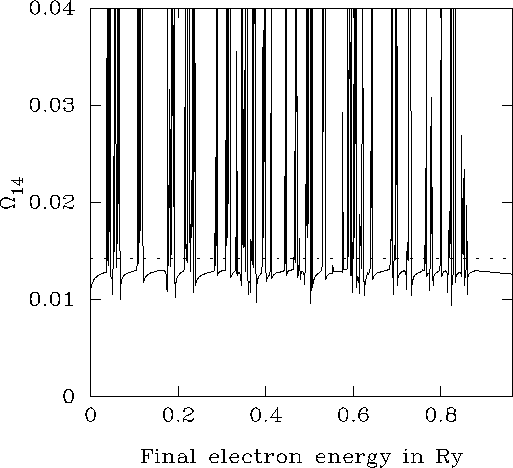
Figure 4: ![]() collision strength
shown over the range
collision strength
shown over the range ![]() (i.e. from
(i.e. from ![]() to
to
![]() ). Full line: present Breit-Pauli calculation; broken line:
DW calculation by Zhang et al. (1990)
). Full line: present Breit-Pauli calculation; broken line:
DW calculation by Zhang et al. (1990)
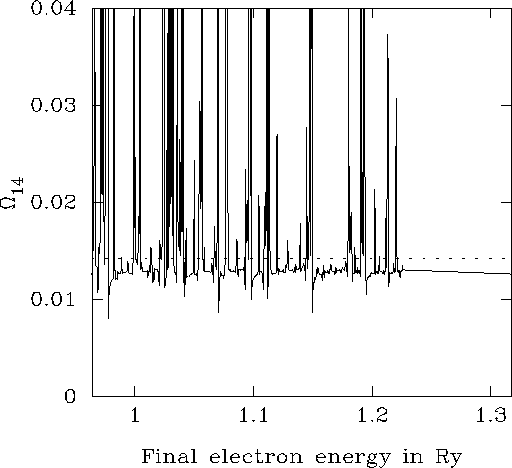
Figure 5: ![]() collision strength
shown over the range
collision strength
shown over the range ![]() (i.e. from
(i.e. from ![]() to
to ![]() ).
Full line: present Breit-Pauli calculation; broken line:
DW calculation by Zhang et al. (1990)
).
Full line: present Breit-Pauli calculation; broken line:
DW calculation by Zhang et al. (1990)
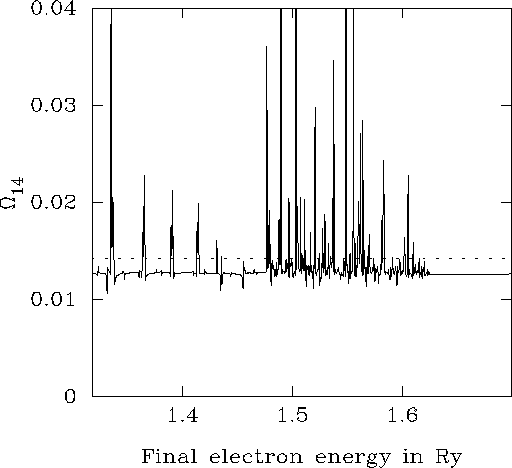
Figure 6: ![]() collision strength
shown over the range
collision strength
shown over the range ![]() (i.e. from
(i.e. from ![]() to
to
![]() ). Full line: present Breit-Pauli calculation; broken line:
DW calculation by Zhang et al. (1990)
). Full line: present Breit-Pauli calculation; broken line:
DW calculation by Zhang et al. (1990)
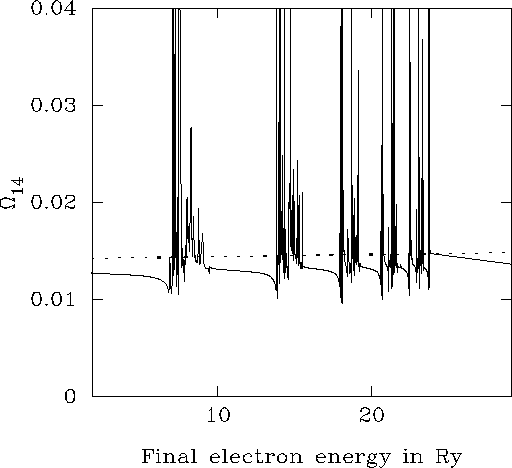
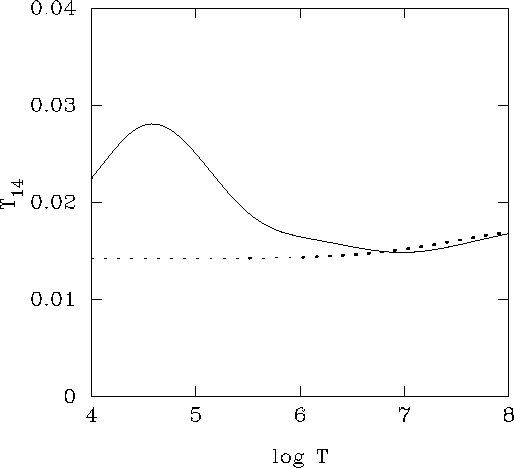
Figure 7: ![]() effective collision
strength for the temperature range
effective collision
strength for the temperature range ![]() .
Full line: IRON Project; broken line: Zhang et al.
(1990)
.
Full line: IRON Project; broken line: Zhang et al.
(1990)
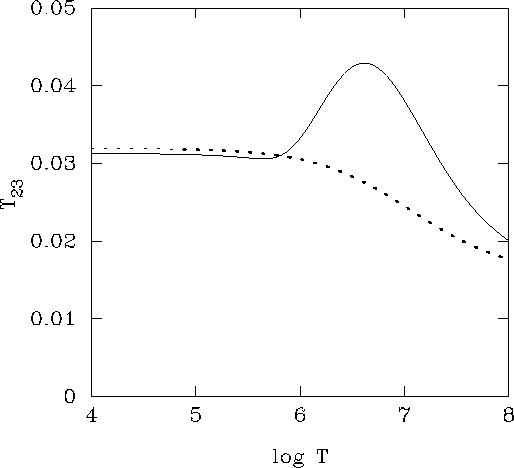
Figure 8: ![]()
![]() effective collision
strength for the temperature range
effective collision
strength for the temperature range ![]() .
Full line: IRON Project; broken line: Zhang et al.
(1990)
.
Full line: IRON Project; broken line: Zhang et al.
(1990)
Acknowledgements
This work was done with the support of a PPARC grant GR/K97608, and an EC network contract ERB CHRX CT920013. We thank David G. Hummer and Hong Lin Zhang for their constructive comments on an earlier version of the paper. The figures were prepared using the "trace vite et bien" graphics software written by Georges Gonczi at the Observatoire de la Côte d'Azur and available from http://www.obs-nice.fr/tvb/tvb.html.