where
which is valid in general for Landolt's stars.
Following the traditional approach developed by Sandage & Tammann
(1974) and de Vaucouleurs (1978), we use the brightest
blue (V-I<+0.5) and red (V-I>+2.0) stars as distance indicators to the
galaxies. The photometric distance modulus, ![]() , was derived via the
mean apparent magnitude of three the brightest blue stars, <B(3B)>, from
the relation
, was derived via the
mean apparent magnitude of three the brightest blue stars, <B(3B)>, from
the relation ![]()
where ![]() is the total apparent magnitude of the galaxy, and AB is
the foreground galactic extinction. Relation (1) reflects well the known
correlation between the luminosity of blue supergiants and the luminosity of
their parent galaxy. Its numerical coefficients were calibrated by Piotto et
al. (1992) and Karachentsev & Tikhonov (1994) using
galaxies with known distances from Cepheids. To derive B magnitudes we use
the empirical relation.
is the total apparent magnitude of the galaxy, and AB is
the foreground galactic extinction. Relation (1) reflects well the known
correlation between the luminosity of blue supergiants and the luminosity of
their parent galaxy. Its numerical coefficients were calibrated by Piotto et
al. (1992) and Karachentsev & Tikhonov (1994) using
galaxies with known distances from Cepheids. To derive B magnitudes we use
the empirical relation.
![]()
which is valid in general for Landolt's stars.
For deriving a modulus from red supergiants de Vaucouleurs
(1978) recommended the use of their magnitude
![]() , irrespective of the luminosity of the parent
galaxy. We applied this rule to all five galaxies observed.
, irrespective of the luminosity of the parent
galaxy. We applied this rule to all five galaxies observed.
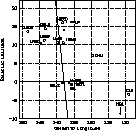
Figure 1: The distribution of galaxies in the IC 342/Maffei complex in
galactic coordinates. The open circles represent galaxies with radial
velocities ![]() , the crosses correspond to other probable
members of the complex. The inclined solid line is the Supergalactic
equator
, the crosses correspond to other probable
members of the complex. The inclined solid line is the Supergalactic
equator
According to RC 3 (de Vaucouleurs et al. 1991) this irregular
galaxy of Sm type has a standard angular diameter of 5.5 arcmin. A
reproduction of its central part in the I-band is presented in
Fig. 2 (click here). Applying the ALLSTAR programme, we carried out the
photometry of 568 stars seen on both CCD frames and having the image
parameters: ![]() SHARP
SHARP![]() CHI
CHI![]() , and
, and ![]() , where
, where ![]() is a formal error of the V-magnitude. SHARP and
CHI are measures of the starts shape and the goodness of fit, respectively,
in the reductions. SHARP is a measure of the difference beetween the
observed width of the object and the width of the psf model. The results
of our photometry are given in Table 2. Its columns contain: (1) -- the
star number, (2) and (3) -- the star coordinates expressed in pixels, (4)
-- the V magnitude, (5) -- the colour index V-I, (6) -- the image
parameter, SHARP.
is a formal error of the V-magnitude. SHARP and
CHI are measures of the starts shape and the goodness of fit, respectively,
in the reductions. SHARP is a measure of the difference beetween the
observed width of the object and the width of the psf model. The results
of our photometry are given in Table 2. Its columns contain: (1) -- the
star number, (2) and (3) -- the star coordinates expressed in pixels, (4)
-- the V magnitude, (5) -- the colour index V-I, (6) -- the image
parameter, SHARP.
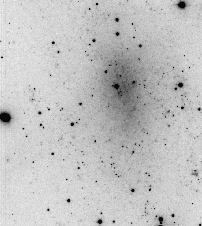
Figure 2: The central part of UGCA 105 in the I band. The size of the CCD
frame is 3.0 by 3.0 arcmin. North at top, East on the left
Figure 3 (click here) shows the "Colour-Magnitude'' diagram derived from these
data. The brightest stars with V<20.5 and "neutral'' colour
0.7<V-I<2.2 are evidently foreground stars. The population of the
brightest blue stars of the galaxy itself appears in the
region of V>22.5 and V-I<0.6 in good agreement with the data
by Tikhonov et al. (1992). Among them we select stars ##459,
226, and 261 as the brightest blue supergiant candidates, excluding from
the consideration two cases, ##20 and 449 which have not sharp stellar images.
Their mean apparent magnitude and colour are ![]() or
or ![]() and
and ![]() .
.
To determine the distance modulus from relation (1), we adopted
![]() for the total magnitude of the galaxy (Huchtmeier &
Richter 1986), and
for the total magnitude of the galaxy (Huchtmeier &
Richter 1986), and ![]() for the galactic extinction
(Burstein & Heiles 1984).
for the galactic extinction
(Burstein & Heiles 1984).
Note, UGCA 105 is quoted to be fainter in the RC3 ![]() .
However, the photometric data by Krismer et al. (1995) and
also our measurements fit well the previous magnitude. With our adopted
parameters the distance modulus of UGCA 105 from blue stars is
.
However, the photometric data by Krismer et al. (1995) and
also our measurements fit well the previous magnitude. With our adopted
parameters the distance modulus of UGCA 105 from blue stars is
![]() .
.
Among the red stars with V-I>2.5 the three brightest ones,
#149, 322 and 227, have ![]() , that gives us the modulus of
, that gives us the modulus of
![]() . The mean of the two estimates,
. The mean of the two estimates, ![]() ,
corresponds to a galaxy distance of
,
corresponds to a galaxy distance of ![]() in agreement with the
earlier value of 3.31 Mpc given by Tikhonov et al. (1992).
Comparing new (CCD) and old (photographic) measurements of the individual
stars, we obtain the average difference in their zero-point
in agreement with the
earlier value of 3.31 Mpc given by Tikhonov et al. (1992).
Comparing new (CCD) and old (photographic) measurements of the individual
stars, we obtain the average difference in their zero-point ![]()
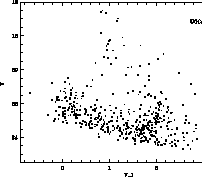
Figure 3: Colour-Magnitude diagram for 568 stars in UGCA 105
This irregular dwarf system with an angular diameter of ![]() has the
lowest radial velocity among all the galaxies of the complex.
Figure 4 (click here) reproduces its CCD frame obtained in the I band. The
total magnitude of UGCA 92 is rather controversial. The catalog RC3 gives
an apparent magnitude of
has the
lowest radial velocity among all the galaxies of the complex.
Figure 4 (click here) reproduces its CCD frame obtained in the I band. The
total magnitude of UGCA 92 is rather controversial. The catalog RC3 gives
an apparent magnitude of ![]() , but in the catalog of Karachentseva &
Sharina (1987) its magnitude is
, but in the catalog of Karachentseva &
Sharina (1987) its magnitude is ![]() . According to the CCD
photometry by Karachentseva et al. (1996) the galaxy has
. According to the CCD
photometry by Karachentseva et al. (1996) the galaxy has
![]() and
and ![]() . From present measurements after
corrections for the Galactic stars the total magnitude and total colour of
UGCA 92 are
. From present measurements after
corrections for the Galactic stars the total magnitude and total colour of
UGCA 92 are ![]() ,
, ![]() , or
, or ![]() and
and
![]() .
.
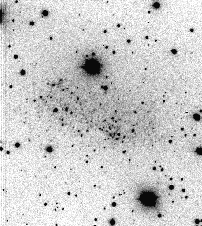
Figure 4: UGCA 92 in the I band. The size and the orientation of the frame
are the same as previously
The results of our photometry of 184 stars are presented in Table 3,
which is structured in the same way as Table 2. Among them 100
stars, situated inside the visible boundary of the galaxy, are indicated by
"1'' in the last column. Figure 5 (click here) shows the Colour-Magnitude
diagram based on these data. The red colour of many stars is caused
obviously by the strong interstellar extinction. We estimated the absorption
value, AB, from the galaxy colour. Adopting for an irregular type galaxy
the mean true colour, ![]() (RC3), we obtain a colour
excess of
(RC3), we obtain a colour
excess of ![]() or
or ![]() . The brightest blue stars belonging to the galaxy itself are
easily distinguished from the foreground stars. For the three brightest,
# 82, 57 and 117 we obtain from relation (2) the mean:
. The brightest blue stars belonging to the galaxy itself are
easily distinguished from the foreground stars. For the three brightest,
# 82, 57 and 117 we obtain from relation (2) the mean:![]() and
and
![]() , which gives the distance modulus of
, which gives the distance modulus of ![]() or
or
![]() .
.
From the C-M diagram it appears that the brightest red supergiants of the galaxy
may have ![]() ,
, ![]() . However, to distinguish
them from foreground stars is a difficult task. Comparing the present photometry
of individual stars with our old CCD data (Karachentsev et al.
1994), we find a systematic difference,
. However, to distinguish
them from foreground stars is a difficult task. Comparing the present photometry
of individual stars with our old CCD data (Karachentsev et al.
1994), we find a systematic difference, ![]() , the reason of which remains unclear to us.
, the reason of which remains unclear to us.
| Object | Filter | Exposure | Date |
| UGCA 86 | V | 600 s | Feb. 6, 1995 |
| I | 600 s | ||
| UGCA 92 | V | 600 s | Feb. 6, 1995 |
| I | 600 s | ||
| UGCA 105 | V | 600 s | Feb. 6, 1995 |
| I | 600 s | ||
| NGC 1569 | V | 300 s | Feb. 7, 1995 |
| I | 300 s | ||
| R | 60 s | ||
| Cas 1 | V | 600 s | Feb. 5, 1995 |
| I | 600 s |
The dwarf galaxy UGCA 86 with its radial velocity ![]() and
standard angular diameter
and
standard angular diameter ![]() remains still the only
indisputable satellite of the spiral
IC 342. Figure 6 (click here) reproduces a CCD frame in the I band, covering
the central part of UGCA 86 and also its bright southern concentration
(= VIIZw9). According to Huchtmeier & Richter (1986) the total
magnitude of UGCA 86 is known with a low accuracy and corresponds to
remains still the only
indisputable satellite of the spiral
IC 342. Figure 6 (click here) reproduces a CCD frame in the I band, covering
the central part of UGCA 86 and also its bright southern concentration
(= VIIZw9). According to Huchtmeier & Richter (1986) the total
magnitude of UGCA 86 is known with a low accuracy and corresponds to ![]() .
.
To estimate the interstellar extinction in the direction to UGCA 86 we measured the colours
of the two brightest parts: the central one and the southern. The mean value for them,
![]() corresponds to
corresponds to ![]() , that yields the colour
excess E(B-V)=+0.91 and
, that yields the colour
excess E(B-V)=+0.91 and ![]() assuming a the typical intrinsic
colour for an irregular galaxy,
assuming a the typical intrinsic
colour for an irregular galaxy, ![]() .
.
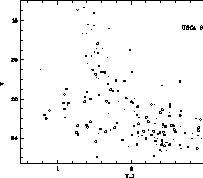
Figure 5: Colour-Magnitude diagram for UGCA 92. the stars inside and
outside the galaxy body are indicated by open circles and crosses,
respectively
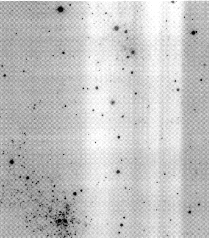
Figure 6: The central part of UGCA 86 (above) and the bright southern
superassociation (the lower left corner) in the I band
The results of ALLSTAR photometry for 444 stars are presented in Table 4 and
in Fig. 7 (click here). The stars which are situated within the region of the
bright southern knot are indicated in the last column with the number "0'',
and by open circles in the C-M diagram. It is evident from
Fig. 7 (click here) that the majority of the brightest "blue'' stars are
concentrated just toward the southern complex. After avoiding some stars
with V-I<0.5, whose photometry is affected by neighbouring diffuse
objects, we selected the stars ![]() and 226 as the brightest blue
supergiant candidates. Their mean apparent magnitude and colour are
and 226 as the brightest blue
supergiant candidates. Their mean apparent magnitude and colour are
![]() and
and ![]() Then the galaxy distance modulus is
27.26 assuming
Then the galaxy distance modulus is
27.26 assuming ![]() and
and ![]() .
.
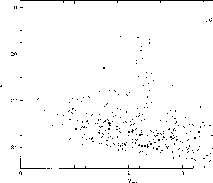
Figure 7: Colour-Magnitude diagram for the southern concentration (open
circles) and for the rest of the field of UGCA 86 (crosses)
Unlike blue stars, the red ones with colour V-I>3.1 are scattered more or less
randomly over the whole galaxy body which makes it difficult to distinguish them from foreground
stars. Adopting the stars #180, 94 and 40 with ![]() and
and
![]() as the red supergiant candidates we obtain a modulus of
as the red supergiant candidates we obtain a modulus of
![]() . The mean of the two estimates,
. The mean of the two estimates, ![]() ,
corresponds to a distance of
,
corresponds to a distance of ![]() , which exceeds appreciably
the old estimate, 1.86 Mpc, by Karachentsev & Tikhonov
(1993). Both these estimates agree quite well with the mean distance
of IC 342 (
, which exceeds appreciably
the old estimate, 1.86 Mpc, by Karachentsev & Tikhonov
(1993). Both these estimates agree quite well with the mean distance
of IC 342 (![]() ). The difference between the new and the old photometric zero-points is
negligible,
). The difference between the new and the old photometric zero-points is
negligible, ![]() , but the increase of the distance estimate is
rather caused by a new selection of blue and red stars for the supergiants
of the galaxy.
, but the increase of the distance estimate is
rather caused by a new selection of blue and red stars for the supergiants
of the galaxy.
This peculiar galaxy with ![]() has been studied by many
authors (Ables 1971; Arp & Sandage 1985;
Karachentsev et al. 1994; Krismer et al. 1995).
The high brightness gradient across NGC 1569 and a presence of dusty furrows
in its body make stellar photometry very hard. The galaxy image in the I
band is shown in Fig. 8 (click here). Its upper part reproduces one half of the
original frame, and the lower one shows the same part of the galaxy after
subtracting a frame smoothed with a window of
has been studied by many
authors (Ables 1971; Arp & Sandage 1985;
Karachentsev et al. 1994; Krismer et al. 1995).
The high brightness gradient across NGC 1569 and a presence of dusty furrows
in its body make stellar photometry very hard. The galaxy image in the I
band is shown in Fig. 8 (click here). Its upper part reproduces one half of the
original frame, and the lower one shows the same part of the galaxy after
subtracting a frame smoothed with a window of ![]() ,
allowing a filtering of extended emission or unresolved stars. An
application of the ALLSTAR package allowed us to perform the photometry of
more than 500 stars inside the galaxy as well as arround it. However, a lot
of stars, especially within its central part, were excluded due to the
condition
,
allowing a filtering of extended emission or unresolved stars. An
application of the ALLSTAR package allowed us to perform the photometry of
more than 500 stars inside the galaxy as well as arround it. However, a lot
of stars, especially within its central part, were excluded due to the
condition ![]() SHARP
SHARP![]() >2. The results of the photometry for the
remainding 173 stars are given in Table 5, which contains also R
magnitudes measured from a short exposure frame. Foreground stars, situated
on the opposite (southern) half of the CCD frame, are indicated by the
number "1''. The distribution of stars in the plane V vs. V-I is shown
in Fig. 9 (click here). The stars from the northern and southern halfs of the
CCD frame are noted by open circles and crosses, respectively. In this
diagram we plot also 113 stars from the central part of NGC 1569, measured
with the Hubble Space Telescope (O'Connel et al. 1994). These data fit each
other quite well.
>2. The results of the photometry for the
remainding 173 stars are given in Table 5, which contains also R
magnitudes measured from a short exposure frame. Foreground stars, situated
on the opposite (southern) half of the CCD frame, are indicated by the
number "1''. The distribution of stars in the plane V vs. V-I is shown
in Fig. 9 (click here). The stars from the northern and southern halfs of the
CCD frame are noted by open circles and crosses, respectively. In this
diagram we plot also 113 stars from the central part of NGC 1569, measured
with the Hubble Space Telescope (O'Connel et al. 1994). These data fit each
other quite well.
In contrast to the galaxies considered previously, NGC 1569 has no sharp left "shoulder'' in its C-M diagram, caused by a population of blue supergiants. Because of this, a distance modulus of the galaxy cannot be derived accurately.
| Name | | a25 | | AB | W50 | | A25 | M25/L | Notes |
| V0 | b/a | Type | | D | MB | | |||
| UGCA 92 | -99 | 2.0 | 16.15 | 3.78 | 61 | 26.25 | 2.0 | 3.7 | present |
| +89 | .48 | Im | 10.5 | 3.44 | 1.78 | -14.3 | 0.17 | paper | |
| NGC 1569 | -89 | 3.6 | 11.86 | 2.18 | 74 | 26.19 | 2.5 | 0.6 | present |
| +102 | .49 | Ip | 11.2 | 3.67 | 1.73 | -16.9 | 0.15 | paper | |
| NGC 1560 | -36 | 9.8 | 12.16 | 1.13 | 125 | 27.37 | 7.7 | 2.8 | (KTGBS, 91) |
| +170 | .15 | Sd | 16.0 | 4.14 | 2.98 | -17.3 | 0.19 | 1) | |
| Maffei 2 | -2 | 3.8: | 16.0 | 8.2 | 305 | 26.77 | 11.9 | 5.2 | (TK, 94) |
| +226 | .49 | SBb | -0.3 | 4.18 | 2.26 | -19.4 | 0.01 | ||
| IC 342 | +33 | 20.9 | 9.1 | 2.56 | 151 | 27.29 | 29.7 | 1.9: | (KT, 93) |
| +247 | .95 | Scd | 10.6 | 5.34 | 2.87 | -20.8 | 0.17: | 2) | |
| Cas 1 | +35 | 2.2 | 16.38 | 5.50 | 49 | 26.15 | 3.1 | 2.8 | present |
| +283 | .77 | Im | 7.1 | 3.31 | 1.70 | -15.3 | 0.06 | paper | |
| UGCA 86 | +67 | 4.5 | 14.2 | 3.82 | 99 | 27.12 | 7.1 | 4.2 | present |
| +275 | .68 | Sm | 10.6 | 4.41 | 2.65 | -17.0 | 0.26 | paper | |
| Cam B | +75 | 2.2 | 16.1 | 1.5: | 20 | - | 1.9 | 0.9 | (HKK, 97) |
| +265 | .50 | Im | 14.4 | 2.20 | (3.0) | -13.2 | 0.32 | ||
| Dwing 2 | +94 | 1.0: | 20.5: | 9: | 100 | - | 6.2 | 3.4 | (BVKH, 96) |
| +314 | .36 | Im | -0.2 | 3.13 | (4.2) | -16.9 | 0.05 | ||
| Dwing 1 | +110 | 2.0 | 19: | 10: | 188 | - | 16.1 | 2.8 | (BVKH, 96) |
| +330 | .63 | SBb | -0.1 | 3.95 | (4.4) | -19.6 | 0.03 | (HLSSW, 95) | |
| UGCA 105 | +111 | 5.5 | 13.24 | 1.48 | 118 | 27.54 | 6.3 | 11.0 | present |
| +279 | .62 | Sm | 13.7 | 3.97 | 3.22 | -16.0 | 0.12 | paper | |
| MB 1 | +189 | 2.4 | 20.5: | 9: | 60 | - | 21.4 | 1.5 | (MB, 95), |
| +420 | .42: | Sd | -0.8 | 2.59 | (5.7) | -17.7 | 0.03 | (HD, 96) | |
| Footnotes: 1) The original estimate, | |||||||||
|
value of AB; 2) The original distance estimate, | |||||||||
| of brightest blue stars from compact HII regions. | |||||||||
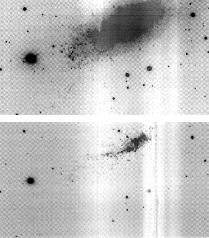
Figure 8: NGC 1569 in the I band. a) Southern half of the original
frame, b) the same part after subtracting the frame smoothed with a
window of ![]()
Adopting the stars #18, 50 and 70 as the three brightest blue supergiant candidates,
we obtain for them ![]() and
and ![]() or
or
![]() . Using the total magnitude of the galaxy,
. Using the total magnitude of the galaxy, ![]() , and an extinction of
, and an extinction of ![]() (RC3) this magnitude gives a
modulus of
(RC3) this magnitude gives a
modulus of ![]() in a good agreement with the estimate of
in a good agreement with the estimate of
![]() by Karachentsev et al. (1994). It should be
noted, however, that we did not find suitable red supergiant candidates
based on their colour (V-I>2.6) and magnitude
by Karachentsev et al. (1994). It should be
noted, however, that we did not find suitable red supergiant candidates
based on their colour (V-I>2.6) and magnitude ![]() . In
comparison with the results of aperture photometry (Karachentsev et
al. 1994), the ALLSTAR photometry data for NGC 1569 reveal a
systematic difference on faint magnitudes, which is probably related to
significant brightness inhomogeneities over the galaxy.
. In
comparison with the results of aperture photometry (Karachentsev et
al. 1994), the ALLSTAR photometry data for NGC 1569 reveal a
systematic difference on faint magnitudes, which is probably related to
significant brightness inhomogeneities over the galaxy.
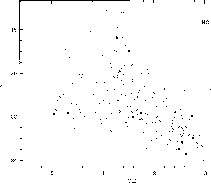
Figure 9: V vs. (V-I) diagram for NGC 1569. Open circles corresponde
to stars measured in the main body of the galaxy, crosses indicate foreground
stars, open squares represent the stars in the central region of the galaxy
measured with the Hubble Space Telescope by O'Connel et al. (1994)
This irregularly shaped galaxy with a low radial velocity of ![]() (Huchtmeier et al. 1995) is situated in a zone of strong
galactic absorption. Figure 10 (click here) shows its CCD image in the I band.
The results of our ALLSTAR photometry for 231 stars in the whole CCD frame
are presented in Table 6. The colour-magnitude diagram, V versus (V-I),
is shown in Fig. 11 (click here). The stars, which are located within the galaxy
boundary, are indicated by number "1'' in the last column of Table 6 and by
open circles in Fig. 11 (click here).
(Huchtmeier et al. 1995) is situated in a zone of strong
galactic absorption. Figure 10 (click here) shows its CCD image in the I band.
The results of our ALLSTAR photometry for 231 stars in the whole CCD frame
are presented in Table 6. The colour-magnitude diagram, V versus (V-I),
is shown in Fig. 11 (click here). The stars, which are located within the galaxy
boundary, are indicated by number "1'' in the last column of Table 6 and by
open circles in Fig. 11 (click here).
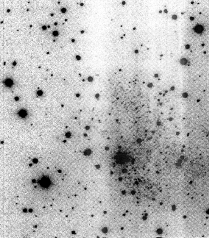
Figure 10: CCD image of Cassiopeia 1 in the I band
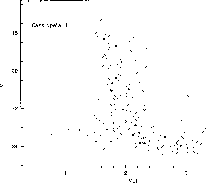
Figure 11: V vs. (V-I) diagram for Cas 1. Stars within the galaxy body
are indicated by open squares the remainder of the frame stars are
noted by crosses
It is evident from the C-M diagram that most moderately bright stars
with ![]() are foreground stars affected by galactic reddening. In
fact, a stellar population of Cas 1 itself can only be recognized with
confidence in the region of
are foreground stars affected by galactic reddening. In
fact, a stellar population of Cas 1 itself can only be recognized with
confidence in the region of ![]() . Taking as the
brightest blue supergiant candidates the stars #138, 89 and 73, we obtain
for them
. Taking as the
brightest blue supergiant candidates the stars #138, 89 and 73, we obtain
for them ![]() and
and ![]() or
or ![]() and
and
![]() .
.
Based on the CCD aperture photometry of the galaxy in V and I bands we
obtain for Cas 1 a total apparent magnitude, ![]() , and
, and
![]() or
or ![]() and
and ![]() . If the
intrinsic colour of irregular type galaxies is adopted for cas 1,
(B-V)0=0.36, we obtain a galactic extinction of
. If the
intrinsic colour of irregular type galaxies is adopted for cas 1,
(B-V)0=0.36, we obtain a galactic extinction of ![]() Note that these data agree well with the quantities,
Note that these data agree well with the quantities, ![]() , and
, and ![]() , derived for Cas 1 by Tikhonov
(1996). A substitution of the measured parameters into Eq. (1) gives
us the distance modulus of Cas 1,
, derived for Cas 1 by Tikhonov
(1996). A substitution of the measured parameters into Eq. (1) gives
us the distance modulus of Cas 1, ![]() or
or ![]() .
.