We compare the quality of different wavelet-based de-noising techniques presented in Sects. 3.1 (click here) and 3.2 (click here) by applying them to originally low-noise solar spectra that have been artificially contaminated by noise as described in Sect. 3.3 (click here). We also compare these techniques with the Fourier filter giving the best results, as found by trial and error. In general the original, uncorrupted spectrum is not known a priori and the goodness of the Fourier smoothing will be lower than the value we obtain.
The added noise has a standard deviation of ![]() in the
continuum of the Stokes V signal and a
in the
continuum of the Stokes V signal and a ![]() for the Stokes I\
spectrum. We first de-noise a solar Stokes V spectrum. Later we illustrate the
techniques further by applying them to a Stokes I spectrum.
for the Stokes I\
spectrum. We first de-noise a solar Stokes V spectrum. Later we illustrate the
techniques further by applying them to a Stokes I spectrum.

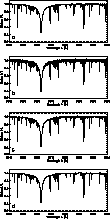
Figure 4: a) Uncorrupted Stokes I spectrum. b) Corrupted version
(![]() ). d) Fourier smoothed spectrum.
d) Wavelet-packets de-noised spectrum using a three-level
decomposition
). d) Fourier smoothed spectrum.
d) Wavelet-packets de-noised spectrum using a three-level
decomposition
We express the goodness of a de-noised spectrum by the variance ![]() ,
,
![]()
where ![]() , represents the uncorrupted
signal and
, represents the uncorrupted
signal and ![]() stands for
the de-noised version of the signal. N is the number of spectral points.
Therefore the standard deviation of the remaining noise of a de-noised
version of a spectrum is simply the square root of the variance.
stands for
the de-noised version of the signal. N is the number of spectral points.
Therefore the standard deviation of the remaining noise of a de-noised
version of a spectrum is simply the square root of the variance.
To obtain a clearer picture of what the de-noising algorithm does in detail we evaluate different types of spectral features individually. In addition to the whole spectral range we consider separately the strong lines (four strongest features between 5247 Å and 5251 Å), the weak lines (four strongest features between 5239 Å and 5247 Å) and the continuum regions, respectively. Note that the "continuum'' includes the (roughly 20) very weak spectral features visible in Fig. 3 (click here)a.
Since the spectral lines and in particular the amplitudes of their peaks are of special interest in astronomical spectral analysis, the threshold value for the Fourier method is adapted to the spectral lines, i.e. it is chosen to restore them as well as possible (therefore the success of the Fourier smoothing for the weak lines must be seen in this context). Since Fourier smoothing cannot remove noise at all frequencies equally well it consequently fails within the continuum. As a result, very small features, although still present in the spectrum, are hardly recognizable, because they are sometimes completely embedded in the random oscillations typical for Fourier smoothed signals. If the Fourier low-pass threshold is lowered a clearer continuum results, but the spectral lines are distorted due to missing high frequencies.
In contrast, our wavelet-packets technique is able to de-noise both the high
frequency (spectral lines) and low frequency (continuum) features
simultaneously (Fig. 3 (click here)). Table 1 (click here) confirms this. The
ratio ![]() is a measure of the reduction in the
noise level over the whole signal due to the de-noising algorithm. The
Fourier method reduces the noise of all spectral features by about the same
amount, it halves
is a measure of the reduction in the
noise level over the whole signal due to the de-noising algorithm. The
Fourier method reduces the noise of all spectral features by about the same
amount, it halves ![]() everywhere, whereas the wavelet
techniques reduces noise within the continuum much more strongly and hence
clearly reveals even very small features of the uncorrupted spectrum which
were completely swamped by the noise (Fig. 3 (click here)). The exception are
the wavelet shrinkage methods, whose results strongly depend on the used
statistical threshold criterion. We were however not able to improve the
result for the continuum regions without simultaneously increasing the
distortion of the spectral lines.
everywhere, whereas the wavelet
techniques reduces noise within the continuum much more strongly and hence
clearly reveals even very small features of the uncorrupted spectrum which
were completely swamped by the noise (Fig. 3 (click here)). The exception are
the wavelet shrinkage methods, whose results strongly depend on the used
statistical threshold criterion. We were however not able to improve the
result for the continuum regions without simultaneously increasing the
distortion of the spectral lines.
Of the tested methods our wavelet-packets technique attains the best
results. Due to the additional transformations, it is able to filter out the
noisy coefficients better than every other tested de-noising algorithm, as
may be seen by scrutinizing Table 1 (click here). In the case of the Stokes V\
spectrum of Fig. 3 (click here), the noise level of the continuum regions is
reduced to ![]() , which means 1.8 times better than the value
obtained by Fourier smoothing. Averaged over the whole spectral range, the
multi-level decomposition results in a gain of about 20% compared to the
classical Fourier smoothing method.
, which means 1.8 times better than the value
obtained by Fourier smoothing. Averaged over the whole spectral range, the
multi-level decomposition results in a gain of about 20% compared to the
classical Fourier smoothing method.
The analysis of a Stokes I spectrum shows the same basic results: see
Fig. 4 (click here) and Table 2 (click here). This spectrum includes the strong
H![]() line and allows us to test the various techniques in the presence
of a strong, heavily oversampled spectral line. Hence this spectrum was
chosen, although it isn't quite ideal since the original spectrum already
was contaminated by roughly
line and allows us to test the various techniques in the presence
of a strong, heavily oversampled spectral line. Hence this spectrum was
chosen, although it isn't quite ideal since the original spectrum already
was contaminated by roughly ![]() noise. Again, we artificially
added noise with a standard deviation of
noise. Again, we artificially
added noise with a standard deviation of ![]() (continuum). Now
the advantages of wavelet-based methods are even more pronounced than in the
case of the Stokes V spectrum. The wavelet techniques are able to
significantly suppress the noise in all spectral regions and attain an
increase of the SNR over the whole signal of about 10% to 30% relative to
Fourier smoothing. Again, our non-orthogonal multi-level decomposition leads
to a large gain in the low frequency parts of the spectrum relative to
Fourier smoothing. A number of small features are clearly recognizable in
the wavelet de-noised version of the signal whereas they are embedded in
random oscillations in the case of Fourier smoothing (Fig. 4 (click here)).
Note that the wavelet-packets technique has also removed much of the noise
present in the original spectrum (top row), which - due to its definition,
Eq. (6 (click here)) - results in a larger
(continuum). Now
the advantages of wavelet-based methods are even more pronounced than in the
case of the Stokes V spectrum. The wavelet techniques are able to
significantly suppress the noise in all spectral regions and attain an
increase of the SNR over the whole signal of about 10% to 30% relative to
Fourier smoothing. Again, our non-orthogonal multi-level decomposition leads
to a large gain in the low frequency parts of the spectrum relative to
Fourier smoothing. A number of small features are clearly recognizable in
the wavelet de-noised version of the signal whereas they are embedded in
random oscillations in the case of Fourier smoothing (Fig. 4 (click here)).
Note that the wavelet-packets technique has also removed much of the noise
present in the original spectrum (top row), which - due to its definition,
Eq. (6 (click here)) - results in a larger ![]() in Table 2 (click here) than
would be present if the original spectrum really were noise-free.
Considering the whole spectral range, our wavelet packets technique again
attains the best results and leads to a roughly 30% lower
in Table 2 (click here) than
would be present if the original spectrum really were noise-free.
Considering the whole spectral range, our wavelet packets technique again
attains the best results and leads to a roughly 30% lower ![]() than the Fourier smoothing method.
than the Fourier smoothing method.

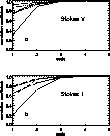
Figure 5: Multi-resolution quality criterion of the Stokes V a) and
Stokes I b) spectra. The noisy signal is represented by a solid line.
Also plotted are the signal de-noised by Fourier smoothing (dotted),
hierarchical thresholding (short dashed), structure detection (dash
dotted), wavelet shrinkage (dash triple dotted) and wavelet-packets (long
dashed), respectively. In Fig. 5 (click here)b the Fourier and Wavelet
shrinkage curves coincides almost completely. For both spectra, the 3-level
decomposition gives the closest approximation of the original noise-free
signal at every resolution
To completely characterize the quality of the de-noised signal we employ a multi-resolution quality criterion as proposed by Starck & Bijaoui (1994). Both the originally noise-free and the de-noised signal are compared in the scale-space plane by calculating the correlation coefficient between corresponding scales. In this manner the signals are compared at different resolutions. The results are presented in Fig. 5 (click here). The noisy signal (solid line) becomes almost identical to the original signal for scales higher than 4. This is, again, due to the fact that noise is mostly concentrated at high frequencies. It is therefore not necessary to calculate more than four scales of the wavelet transform. The wavelet-packets technique (long dashes) is again found to be superior to all of the tested methods. The additional decomposition of each scale leads to a very high fidelity between the noise-free and the de-noised spectrum at all resolution levels.