
Up: Multi-spectral study of
On the atlas of profiles, (Fig. 1 (click here)), a classical flat (disk)
distribution of light, following the well-known exponential law, translates
into a linear relation. Alternatively, a plot of the surface brightness
versus the 0.25 power
of the equivalent radius allows to recognize the objects having a light
distribution of "spheroidal galaxy'' type. One would expect the occurrence of
"mixed'' profiles indicating the probable presence of two dynamically
different
populations, the disk-like one and the spheroidal one, making such objects low
luminosity equivalents of normal giant flattened galaxies.
The preliminary study of the brightness profiles allows us to sort out:
- 10 objects with a r1/4 law profile,
- 7 objects with exponential profiles and sometimes a
brightness excess limited to the very central area.
- 6 objects with profiles departing conspicuously from the standard laws,
among these, 4 can be interpreted by a superposition of an exponential
brightness distribution with a spheroidal one.
In the following we discuss some characteristics of the derived surface
brightness profiles.
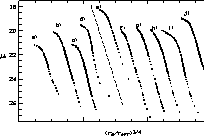
Figure 3 (click here) shows, in ( ,
,  )
coordinates, the observed brightness distribution of the 10 objects
exhibiting a linear r1/4 law across a substantial range of equivalent
radius. We assume that the surface brightness profile follows the empirical
law as given by De Vaucouleurs (1948, 1953)

where I is the intensity at a given r and  is the intensity
at the effective radius. This relation is more convenient to use in terms of
surface brightness

Genuinely fitting a linear relation on the ( versus
(
 )
plot of the surface brightness in the range of
  not affected by
seeing effects, we get the slope and the deviation of the profile from the pure
r 1/4 law. It appears that for some galaxies (Mk 1450, Mk 1480 and SBS
1147+520) the slope is different in the two bands. Note that the 8.327 slope is
intrinsic to the r1/4 law, as written in terms of normalized
coordinates (
 ,
,  ). A value
of the slope differing significantly from the canonical 8.327 usually
implies that the adopted
  is not correct. Since the
determination of
  is made through an extrapolation process (in
order to derive the asymptotic magnitude from the cumulated magnitude growth
curve) the errors are quite difficult to control, especially when the frames
are insufficiently deep. However, another effect is also responsible for the
deviation from a pure r1/4 law: if the galaxy houses a population
dynamically different from an isothermal spheroid (King 1966)
that contaminates the light of the latter, departure from the r1/4 law
will be quickly visible. This is the obvious case for extended envelopes
that show up as excess light above the r1/4 (e.g. SBS0136+328, Mk 324
and Mk 1426). It should be underlined that these outer envelopes differ in
color from that of more central regions, suggesting a different stellar
content. Also, if the [
 , (
, ( ] relationship
is linear but with a slope different from 8.327, on frames sufficiently deep
such as to rule out significant errors on
  , it could be
suggested that a non-spherical population is quite continuously
superimposed to the spherical one, (but with a moderate contribution to the
total light) so that the scale length is changed (as could be the case for
Mk 324).

Figure 3: Reduced surface brightness distributions of the 10 galaxies
obeying an
r1/4 law. The abscissa is the quantity  , the
ordinate is the surface brightness in magnitudes per square arc second. The
tick marks in abscissa represent a 0.5 interval. The dashed line has a slope of
8.327 and represents the "pure'' de Vaucouleurs' law. The various curves,
translated from each other to ensure legibility, are for: a)
SBS 0136+328, b)
SBS 1054+504, c) SBS 1147+520, d) Mk 324, e) Mk 996,
f) Mk 1434, g) Mk 1450,
h) Mk 1480, i) Mk 1418, j) Mk 1426
In most cases, the exponential law (de Vaucouleurs 1959)
applies right after the seeing limit ( to 3'').

or, in terms of surface brightness:

where 1/r0 is the scaling factor in  and
and  is the
central value of the surface brightness. In other cases, there is a
significant contribution of a small brighter central component. See also the
case of SBS 1006+578 in Sect. 3.5. Table 4 (click here) gives the resulting
numerical values of the linear regression.
| Object name | d [Mpc] | MB |
 [pc](B) [pc](B) | r24[pc](B) |
|
| | |  [pc](R) [pc](R) | r24[pc](R) |
| SBS 0136 | 84.5 | -17.72 | 1910 | 2181 |
|
| | | 1184 | 3472 |
|
SBS 0940 | 23.0 | -14.34 | 643 | 577 |
|
| | | 503 | 638 |
|
SBS 1006 | 18.6 | -14.80 | 362 | 655 |
|
| | | 473 | 864 |
|
SBS 1054 | 18.6 | -15.16 | 348 | 661 |
|
| | | 411 | 1070 |
|
SBS 1147 | 15.0 | -13.60 | 197 | 332 |
|
| | | 205 | 559 |
|
SBS 1331 | 10.8 | -15.14 | 616 | 761 |
|
| | | 635 | 988 |
|
SBS 1413 | 11.1 | -13.83 | 803 | 505 |
|
| | | 505 | 512 |
|
SBS 1428 | 32.1 | -16.51 | 653 | 1376 |
|
| | | 665 | 1948 |
|
SBS 1533 | 44.2 | - | - | - |
|
| | | 825 | 2065 |
|
Mk 324 | 23.9 | -16.98 | 1131 | 1041 |
|
| | | 536 | 1405 |
|
Mk 900 | 17.5 | -16.83 | 1286 | 1137 |
|
| | | 1729 | 2888 |
|
Mk 996 | 21.4 | - | 558 | 1532 |
|
| | | 1454 | 1913 |
|
Mk 1131 | 27.3 | -17.24 | 2453 | 1316 |
|
| | | 911 | 2808 |
|
Mk 1308 | 13.6 | -15.80 | 505 | 931 |
|
| | | 460 | 1392 |
|
Mk 1416 | 28.7 | -15.31 | 541 | 881 |
|
| | | 586 | 1281 |
|
Mk 1418 | 6.3 | -14.62 | 223 | 484 |
|
| | | 260 | 803 |
|
Mk 1423 | 15.5 | - | - | - |
|
| | -17.17 | 948 | 1441 |
|
Mk 1426 | 25.2 | - | - | - |
|
| | -17.23 | 561 | 1658 |
|
Mk 1434 | 27.6 | -14.84 | 251 | 601 |
|
| | | 264 | 866 |
|
Mk 1450 | 12.6 | -13.52 | 127 | 306 |
|
| | | 141 | 641 |
|
Mk 1480 | 24.3 | -15.36 | 358 | 738 |
|
| | | 465 | 1144 |
|
Mk 1481 | 25.1 | -15.21 | 737 | 917 |
|
| | | 812 | 1154 |
|
Mk 1499 | 36.7 | -16.29 | 650 | 1138 |
|
| | | 926 | 2068 |
| | | | |
Table 4: Absolute magnitudes and linear radii
4 galaxies show a profile reminiscent of the classical superimposition of a
central bulge component with an underlying exponential law extending to the
outer parts where this latter becomes dominant. The exponential is easily
interpreted as showing up the presence of a disk. Only 2 cases show a slight
systematic blueing outwards. (SBS 1413+495 and SBS 0940+544C)
Table 4 (click here) lists the integrated parameters on the observed galaxies
together with metric observables deduced from the photometry. The distance
dependent quantities have been derived using  , the redshifts of Table 2 (click here) corrected from
Galactic rotation (using
  )
and from the Virgo-centric infall model of Aaronson et al.
(1981) as reformulated by Bottinelli et al. (1986) using
the recent Virgo distance based on Cepheid photometry by Freedman et al.
(1994).
Table 4 (click here) is arranged as follows:
Column 1: Name of the galaxy
Column 2: Distance in Mpc.
Column 3: Absolute B magnitude from our asymptotic magnitude.
Column 4: Effective equivalent radius in pc, in B and R colors.
Column 5: Isophotal equivalent radius at  in pc, in B and
R colors.
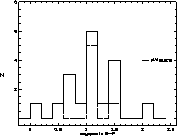
Figure 4 (click here) displays the histogram of the asymptotic B-R colors.
The asymptotic B-R color ranges from 0.22 to 2.16. The mean
color of the
sample is 1.09 (with no correction for reddening due to Galactic or internal
absorption) which places the sample among the blue galaxy population. Fukugita
et al. (1995) have recently revised the integrated colors of various
galaxy types and show that normal field galaxies of elliptical types have
B-R = 1.6 while the bluest spirals of type Scd have B-R = 1.0 (from
synthetic color computation, perhaps a little redder from observations). 2
objects in our sample are very blue with  : SBS 1413+495 (B-R =
0.22) and Mk 324
(B-R = 0.44). We note that the galaxies whose brightness distribution obey
an r1/4 law follow the same distribution of colors as that of the whole
sample.
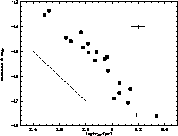
Figure 5 (click here)a shows relations between the logarithm of the effective
radius and the absolute magnitude in B, uncorrected for Galactic and
internal absorption. The two quantities are correlated (correlation
coefficient of 0.82 in B and 0.66 in R) as expected, with a slope of
 in B and
  in R.
in R.
In B, there is a clear deviation from the expected slope of -5 implied
by a dependence of the luminosity on the square of the radius. It should be
remembered that Heidmann (1969) found a dependence of the
luminosity on rk with k = 1.9 for giant ellipticals and k = 2.8 for
giant spirals. However Fraser (1977) found k = 2.1 for Virgo
spirals). The tendency in our sample is towards an excess B luminosity for
the less luminous objects, for a given effective radius. Although the
dispersion in both colors may be explained partly by the extrapolation
errors in the determination of  (see Sect. 4.1.2) and the
errors on the distance moduli, the trend would rather be due to the
selection bias of the sample. The most extreme blue compact dwarfs are
selected in the Byurakan surveys because their central surface brightness in
the blue part of the spectrum, reinforced by the starburst, is intrinsically
high. The use of
  favours the weight of the central regions
where the burst dominates the light (see Table 4 (click here)), and this bias is
stronger on the intrinsically faint objects.

Figure 4: Distribution of asymptotic B-R colors
In R band, there is a large dispersion of the representative points, but,
as expected, the "blue'' selection bias as explained above is much less
apparent.


Figure 5: Absolute magnitude-radius relations:
a) at  , (effective) in B band,
b) at r = r24, (isophotal at
  )
in B band
Figure 5 (click here)b shows the same relationship using the isophotal radius
r24. This radius is systematically larger than  , and
therefore integrates light largely emitted by the underlying evolved
population, hence reducing the weight of the starburst component. The
dispersions are much reduced, the slopes are
  in B and
 in R with respective correlation coefficients of 0.90 and
0.96. The slope in B is significantly different from -5, but in the
opposite sense as observed in the (MB,
  ) plot. Most of
the discrepancy comes from Mk 324 and Mk 1131 which both exhibit an extended
envelope that contributes significantly to the light beyond r24.
Excluding these galaxies, we find a slope of
  (correlation
coefficient: 0.97) for the (MB, r24) diagram, and hence an almost
identical behaviour in B and R, and consistency with a luminosity
proportional to the square of the isophotal radius.
Huchra (1977) found that the luminosity of Markaryan galaxies,
irrespective of their morphological type, closely follows a r2
dependence (r being an estimate of the isophotal radius),
"indicating approximate constancy of mean surface brightness over the
absolute magnitude interval studied''. However, there is only a small
number of dwarf Markaryan ( ) in Huchra's study, and
the selection effects towards compact, i.e. high surface
brightness objects, in our sample are certainly different from those
present in an all-type Markaryan galaxy sample.
Compact galaxies were defined by Zwicky (1967, 1971) as being
galaxies for which the central surface brightness is brighter than  in B.
But this definition applies, at least partly, to almost all galaxies having
giant star-forming regions and/or a bright nuclear component. It is usually
assumed that a dwarf "compact'' galaxy associates two basic features: a
short scale length of the brightness distribution and a high
"average'' surface
brightness, this latter being the observable translation of a higher than
normal stellar luminosity density.
Figure 6 (click here) displays the histogram of the mean surface brightness
inside the effective radius measured in B band. The average surface
brightness of the night sky is around  .
The median value, (uncorrected for Galactic foreground extinction) observed
for our sample is
  and several objects have
especially bright values (namely Mk 996, Mk 1418, Mk 1434 and Mk 1450).
Compared to a sample of DDO dwarf galaxies (de Vaucouleurs et al.
1981) that exhibit low or moderate star formation rates in the
average, and is largely dominated by disk late-type systems, the Byurakan
dwarf blue compacts are brighter in
  by some two
magnitudes. From Ichakawa et al. (1986), we get that the average of
 in 69 dwarf ellipticals of the Virgo Cluster is
  . The Byurakan BCDGs among which we find a high
proportion of dwarf elliptical galaxy analogs (but with r1/4 laws while
dE's of Virgo are claimed to have exponential brightness distributions:
Ichikawa et al. 1986) are again some two magnitudes brighter.
Figure 7 (click here) displays the histogram of the concentration index
C21(B) as defined in Sect. 3.4.1. This index averages from 1.6 to 1.9
for diffuse late-type spirals, and reaches about 2.5 to 2.8 for normal
ellipticals (Fraser 1972, 1977; de Vaucouleurs & Aguero
1973) while diffuse dwarf magellanic have  (Ables 1971). The present sample peaks at 1.9 and one may
notice three anomalously "concentrated'' objects (namely Mk 324, Mk 900 and
Mk 1308).
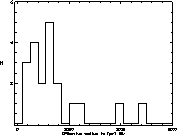
Finally, Fig. 7 (click here) shows the histogram of the effective radii in pc
measured in B band. The bulk of our galaxies have indeed small effective
radii with 9 objects below 500 pc.

Figure 6: Distribution of the mean surface brightness inside 

Figure 7: Distribution of the concentration index C21 in B light

Figure 8: Distribution of effective radii in pc (B band)


Up: Multi-spectral study of
Copyright by the European Southern Observatory (ESO)
web@ed-phys.fr


