As we have emphasized, the difference between carbon- and oxygen-rich stars depends on several parameters (the abundance of specific elements, the evolutionary state of the star, its chemical composition, its mass, etc.) to which the pulsation and the light curve are related. We have just seen that the light curve parameters are not sufficient to distinguish C stars. These parameters are mainly linked to the stellar rather than circumstellar properties. The properties of their circumstellar envelopes differ, but it is well known that parameters linked principally to the circumstellar medium, such as IRAS colors, also are not sufficient to distinguish C stars. Yet it may be that the combination of both sets of parameters, respectively reflecting the stellar and circumstellar properties, could be used to distinguish carbon- from oxygen-rich LPVs. Therefore we now look jointly at light curve parameters and IRAS colors.
Figure 3 (click here) shows the classical ([12]-[25],[25]-[60]) IRAS color-color diagram separately for each cluster found by our light-curve classification. Only IRAS fluxes with a good quality (3) are considered. It can be seen that:
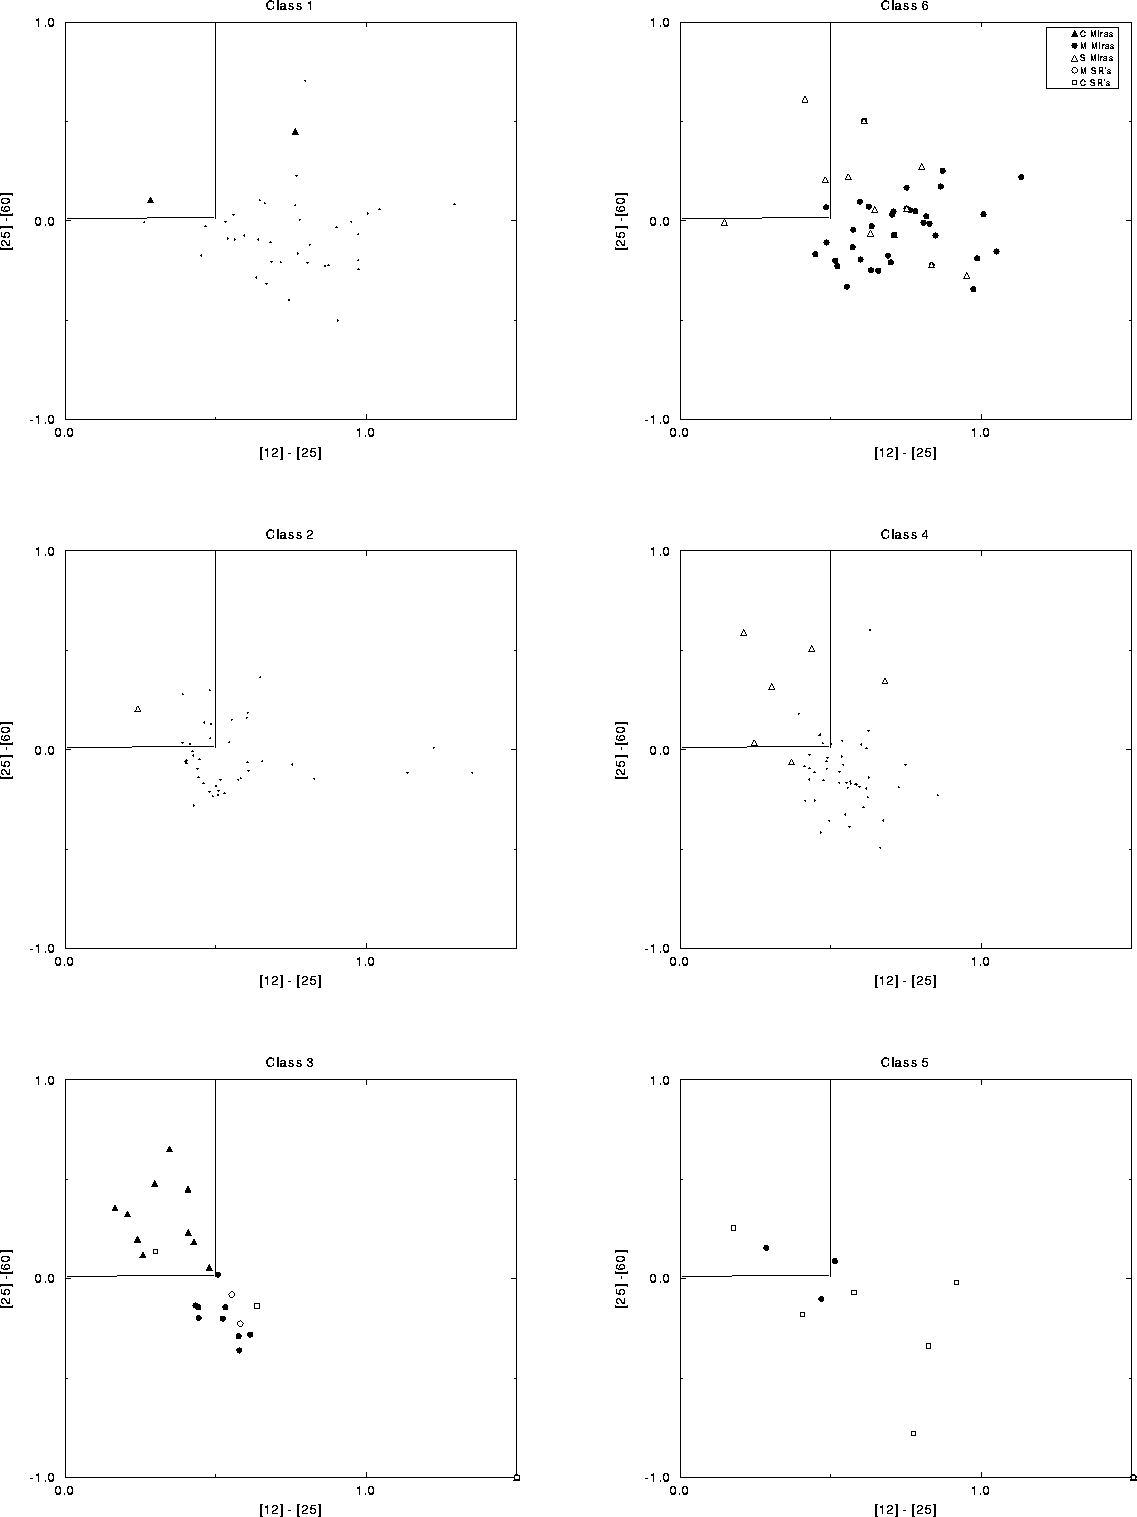
Figure 3: IRAS color-color diagram for each cluster
We have now to check if this result is robust or only due to a peculiarity of our sample. So we selected all miras in the GCVS with IRAS colors of quality 3. To generate this sample we used the database ASTRID (Mennessier et al. 1996).
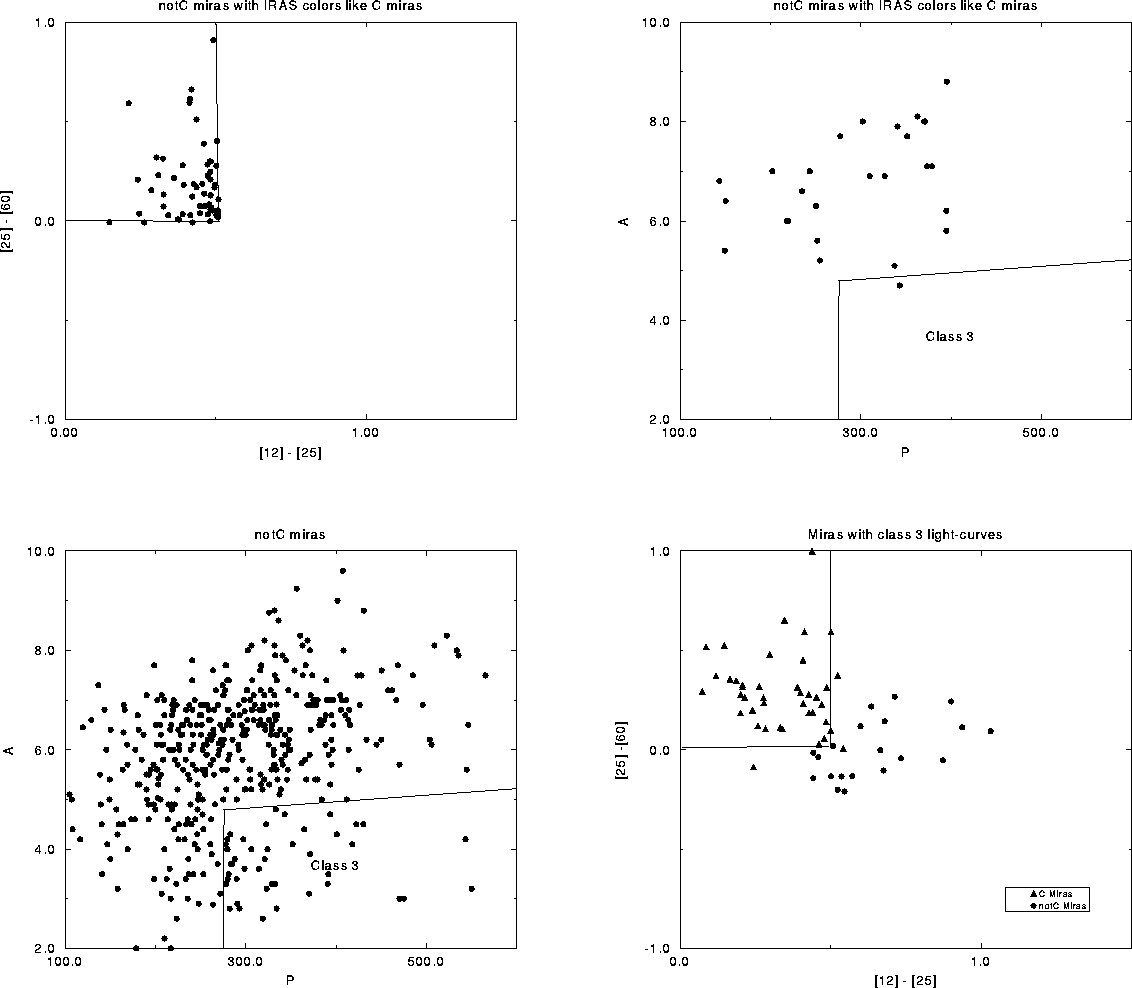
Figure 4: IRAS color-color diagram and location
on (P, A) plane for different samples
The results are displayed in Fig. 4 (click here). It must be noted
that to compute the amplitude, we must compensate for
the fact that the GCVS indicates not the mean
maxima and minima, but the most luminous and the least
luminous observed magnitudes. To define the corresponding
limits of C3, we must apply statistical corrections
(Mennessier & Guibert 1983) to the GCVS data:
![]()
and
![]()
We confirm that: