For the classification of the stars with optical spectra we applied different methods: Classification of the spectra by comparison with two atlases of digital spectra, fitting of line profiles to the Balmer lines, and finally estimating the spectral subtypes from the equivalent widths of the HeI and some metal lines. From these three methods only the first one worked sufficiently well for all stars. The profile fitting and the equivalent widths can only be regarded as additional constraints on the spectral types and effective temperatures for some of the stars. Since the two latter methods did not add much information, they are not discussed here.
However, the profile fits led to the knowledge of the central wavelengths
of the Balmer lines.
We could thus derive rough radial velocities for our program stars.
They are given in Table 6 (click here).
All radial velocities lie in the range from ![]() km s
km s![]() (N44:13) to 295 km s
(N44:13) to 295 km s![]() (N44:09) with a clear peak of the distribution
around 265 km s
(N44:09) with a clear peak of the distribution
around 265 km s![]() .
We estimate the uncertainty of the radial velocities to
.
We estimate the uncertainty of the radial velocities to ![]() 30 km s
30 km s![]() .
Our radial velocities are in good agreement with the radial velocities
of the molecular lines (
.
Our radial velocities are in good agreement with the radial velocities
of the molecular lines (![]() 283 km s
283 km s![]() ) found by Chin (1995).
) found by Chin (1995).
The lines in the optical spectra of our stars can be identified by comparison with the atlases of digital spectra of Walborn & Fitzpatrick (1990) and Fitzpatrick (1991). The atlas of Walborn & Fitzpatrick (1990) covers O and B type spectra for a large range of spectral subtypes and luminosity class es. The sample spectra are from galactic stars and thus may differ systematically from our target stars due to the lower metallicity of the LMC. The atlas of Fitzpatrick (1991) gives sample spectra from LMC stars and therefore of appropriate metallicity. However, this atlas is only valid for supergiant B stars and thus not useful for all stars of our sample. For the B Ia types in our sample there is a good agreement between the classifications derived from both atlases. Therefore we do also trust the classification from the Walborn & Fitzpatrick (1990) atlas for the non Ia luminosity class stars.
The spectra were taken with the aim to help to refine the age determination of the association. Therefore it is necessary to judge from the spectra if a star is evolved or not, i.e. to determine its luminosity class. However, when comparing the spectra with the sample spectra in the atlases, it soon became clear that a determination of the luminosity class is very difficult. This is mostly due to the fact that for a given spectral type the changes of line widths and line strength ratios with luminosity class are very small.

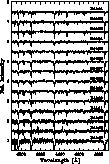
Figure 5: The normalized optical spectra of the stars in N44.
The wavelength range from 3900 to 4900 Å is shown.
There is an offset of 0.5 units in relative intensity from one
spectrum to the next

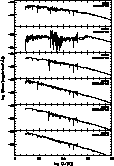
Figure 6: a) The IUE spectra of the stars 01 to 06 in N44 and fits of
Kurucz (1992) model atmospheres. The open circles denote the
magnitudes in U, B, and V passbands.
The numbers give ![]() ,
, ![]() , and
, and ![]() of the plotted model.
In the case of N44:02 the width of the U filter is indicated
by a horizontal line to explain the large deviation between the
U magnitude and the flux of the model atmosphere
of the plotted model.
In the case of N44:02 the width of the U filter is indicated
by a horizontal line to explain the large deviation between the
U magnitude and the flux of the model atmosphere

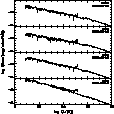
Figure 6: b) Same as in Fig. 6 (click here)a for the stars 09 to 12.
In the case of N44:12 the flux of the LWP spectrum
seems to be erroneous. This part thus has not been
used for the fit of the model atmospheres
From the UV spectra we derived effective temperatures and surface gravities by fitting model atmospheres from the ATLAS 9 program (Kurucz 1992). We used the models with [M/H] = -0.3 dex, however, our results do not change when we use [M/H] = -0.5 dex. The photometric magnitudes in the U, B, and V passband were converted to fluxes (Heber et al. 1984), plotted together with the IUE spectra and used for the fit of the model atmospheres.
It turned out that there exists no unambiguous solution for ![]() ,
, ![]() , and
, and
![]() for each spectrum.
Therefore we varied
for each spectrum.
Therefore we varied ![]() by steps of 0.05 mag
in the range suggested by the photometry, thus resulting in several sets of
by steps of 0.05 mag
in the range suggested by the photometry, thus resulting in several sets of
![]() ,
, ![]() , and
, and ![]() .
A constant galactic foreground reddening of
.
A constant galactic foreground reddening of ![]() mag was assumed
(see e.g. Oestreicher et al. 1995) for which the extinction law of
Savage & Mathis (1979) was used.
The remaining portion of the reddening was assumed to be of LMC origin
and the extinction law of Howarth (1983) was used for its correction.
For each spectrum one fit is shown in
Figs. 6 (click here)a and 6 (click here)b.
mag was assumed
(see e.g. Oestreicher et al. 1995) for which the extinction law of
Savage & Mathis (1979) was used.
The remaining portion of the reddening was assumed to be of LMC origin
and the extinction law of Howarth (1983) was used for its correction.
For each spectrum one fit is shown in
Figs. 6 (click here)a and 6 (click here)b.
In the case of N44:03 and N44:05 no SWP spectrum was available, thus the fit of the model atmospheres had to rely on the LWP spectrum and the optical flux values alone. This makes those fits more uncertain. In the case of N44:12 we found a problem with the flux in the LWP spectrum. It seems that LWP and SWP do not fit properly together, although the exposure times were corrected accordingly for both spectra before combining them. There is too much flux in the LWP compared to both, the SWP spectrum and the photometry. A model atmosphere which fits to both parts of the spectrum is in principle possible, but it would totally fail to reproduce the flux values from the photometry.
We then collected all information from the methods described above to determine the final classification for our sample stars. Due to the difficulties in deriving a reliable luminosity class from the comparison with the spectral atlases, we used the photometric information to derive the luminosity class es by comparison with the tables of Schmidt-Kaler (1982), whereas we took the spectral subtypes from our classification. This led to our final classifications which are summarized in Table 6 (click here). For each spectral type we give the corresponding effective temperature as tabulated by Schmidt-Kaler (1982).

Table 6: Spectral types, effective temperatures and radial velocities
of our sample stars and comparison of identifications,
spectral types and effective temperatures with Oey & Massey (1995)
In Table 6 (click here) we do also give the spectral types which were derived by Oey & Massey (1995). These are mostly in fair agreement with our classification. The largest deviation occurs for N44:07 with a discrepancy of two spectral subtypes and for N44:08 with a large difference in temperature. We found luminosity class III for the stars N44:04 to N44:10, which is mainly due to the comparison of the absolute magnitudes with the tables of Schmidt-Kaler (1982), whereas Oey & Massey (1995) attribute quite different luminosity class es to those stars.