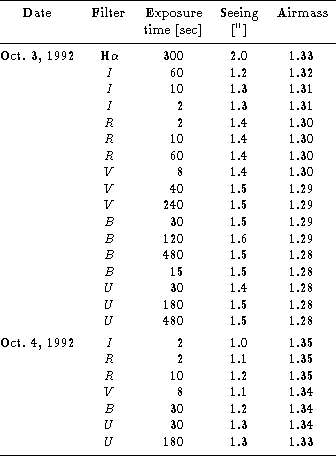
Table 1: Observing log for the photometry of N44
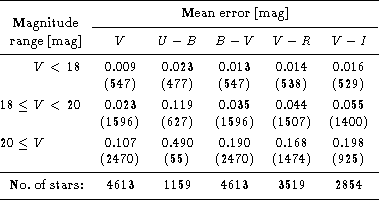
Table 2: Mean statistical errors of stellar magnitudes and colours.
The number of stars in the corresponding magnitude range
is given in parentheses. The last line
gives the total number of stars in our final table
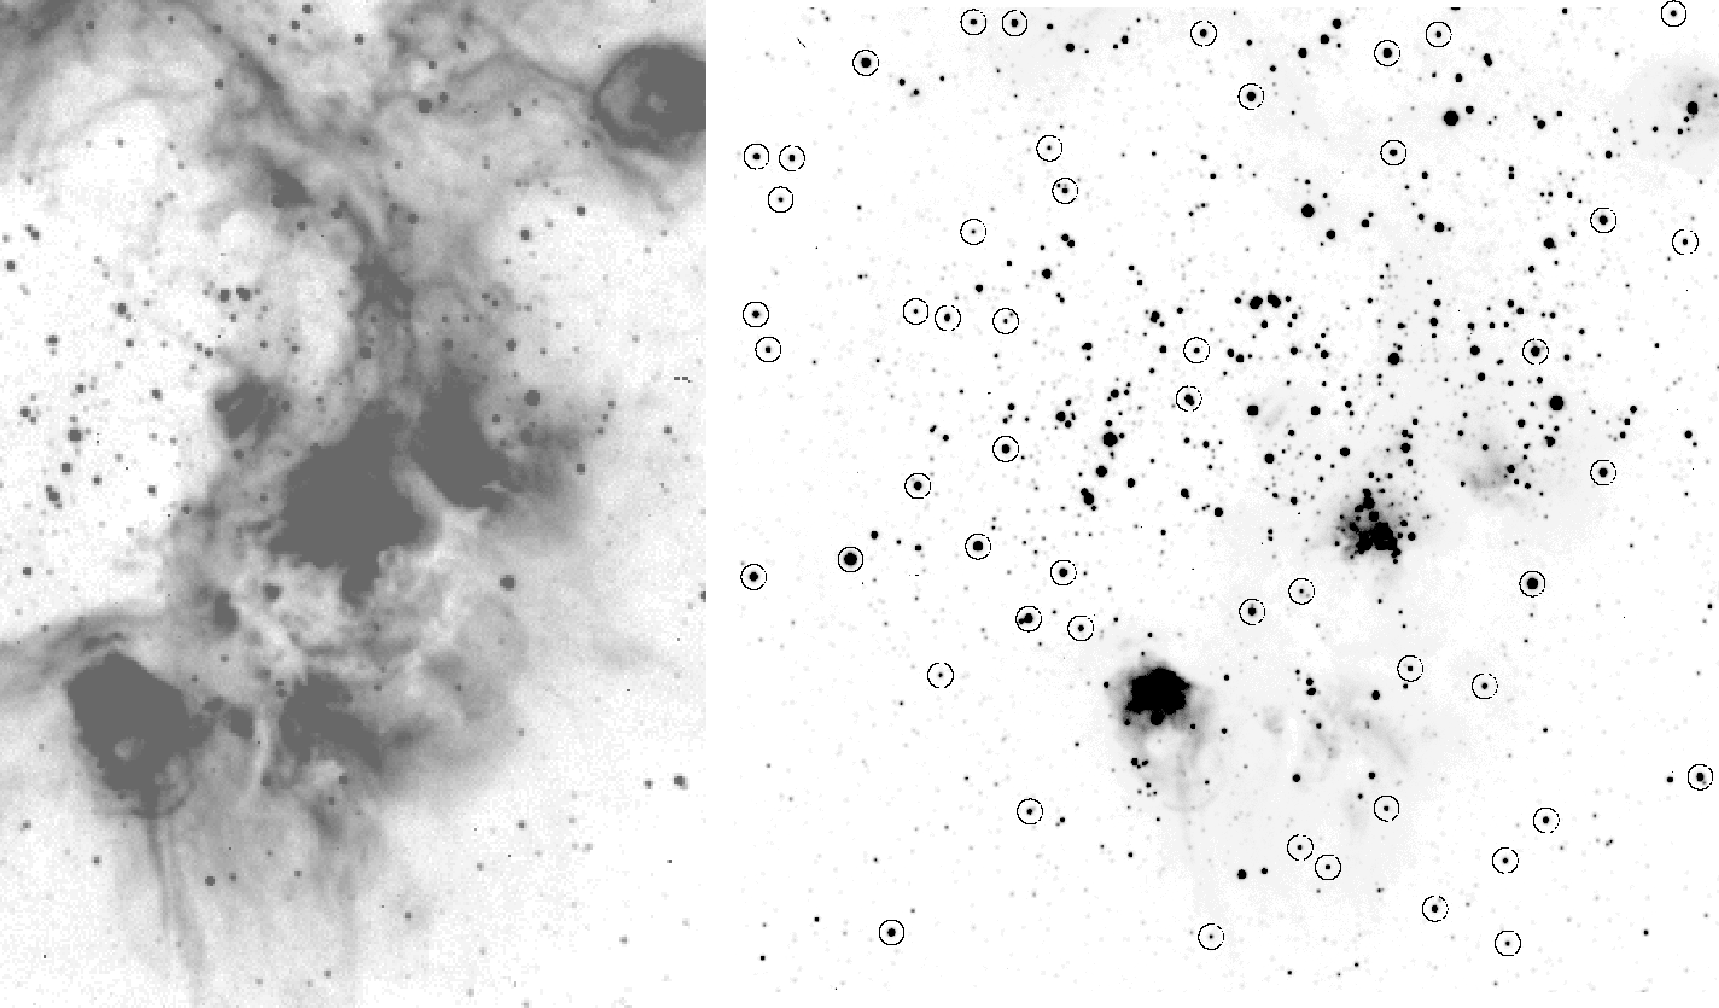
Figure 1: CCD images of N44
in the H![]() (left) and V passband (right).
North is up and east to the left. The size of the field of view
is
(left) and V passband (right).
North is up and east to the left. The size of the field of view
is ![]() in both cases.
The stars in our field of view which are present in the
MACS (Magellanic Catalogue of stars;
Tucholke et al. 1996)
are marked on the V exposure
in both cases.
The stars in our field of view which are present in the
MACS (Magellanic Catalogue of stars;
Tucholke et al. 1996)
are marked on the V exposure
After standard image reduction with MIDAS and IRAF, profile fitting photometry has been performed with DAOPHOT running under IRAF. Special care has been taken to identify close optical binaries and thus to reach an exact positioning of especially the bright stars in the CMD (see also Will et al. 1995b, Sect. 4). Mean values of the photometric errors for three magnitude ranges as given by DAOPHOT are printed in Table 2 (click here). The number of stars in the corresponding bins and the total number of stars are also given. It has to be admitted that those errors only reflect the uncertainties due to the photon statistics. Other effects, such as the quality of the profile fits and the influence of strong crowding, could increase those errors significantly.
Observing conditions on Oct. 4 were better than in the night before, thus
the images of that day have first been calibrated using the calibration
stars around PG 0231+051 (Landolt 1992).
For U, B, and V passbands,
we used the extinction coefficients from Grothues & Gochermann (1992),
i.e. ![]() mag,
mag, ![]() mag,
and
mag,
and ![]() mag.
For the R passband we used
mag.
For the R passband we used ![]() mag,
for the I passband we didn't apply an extinction correction.
The H
mag,
for the I passband we didn't apply an extinction correction.
The H![]() magnitudes have not been calibrated.
The images of Oct. 3 then have been calibrated with those of Oct. 4.
magnitudes have not been calibrated.
The images of Oct. 3 then have been calibrated with those of Oct. 4.
The final data are listed in Table 3 which is available in electronic form only (see the footnote on the front page). Table 3 contains 4613 stars for which information in B and V and thus also in B-V is available. In addition there is a U-B colour available for 1159 of these stars, a V-R colour for 3519 stars, and a V-I colour for 2854 stars. Figure 2 (click here) shows two CMDs (V vs. B-V and V vs. U-B) of all stars in the field of view.
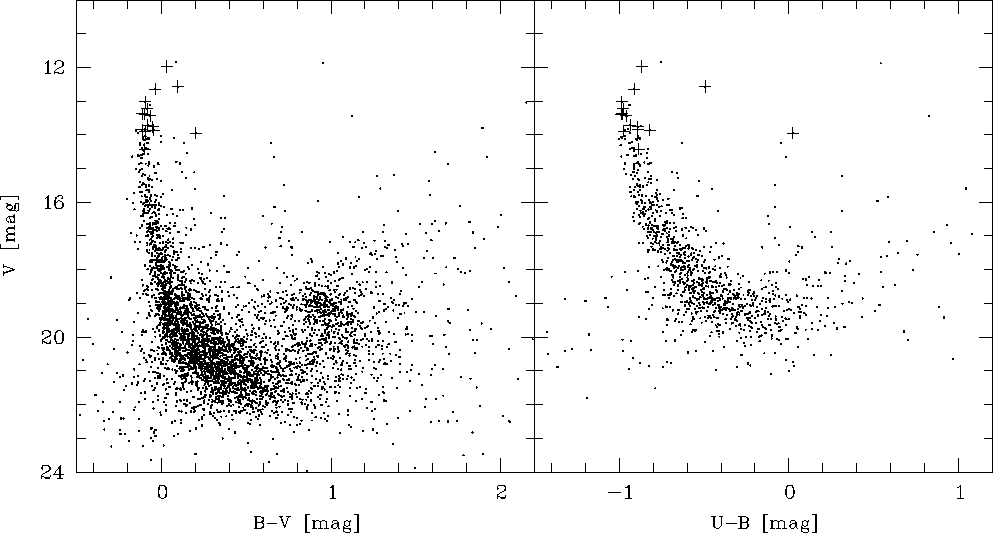
Figure 2: CMDs, V vs. B-V (left panel) and V vs. U-B (right panel),
for all stars in the field of view.
The target stars for spectroscopy are marked by crosses
Table 4, which is also available electronically only, gives all 51 stars which could be cross identified in the MACS (Magellanic Catalogue of Stars; Tucholke et al. 1996; de Boer et al. 1995). These stars may serve as an astrometric reference grid. A finding chart for those stars is given in Fig. 1 (click here).
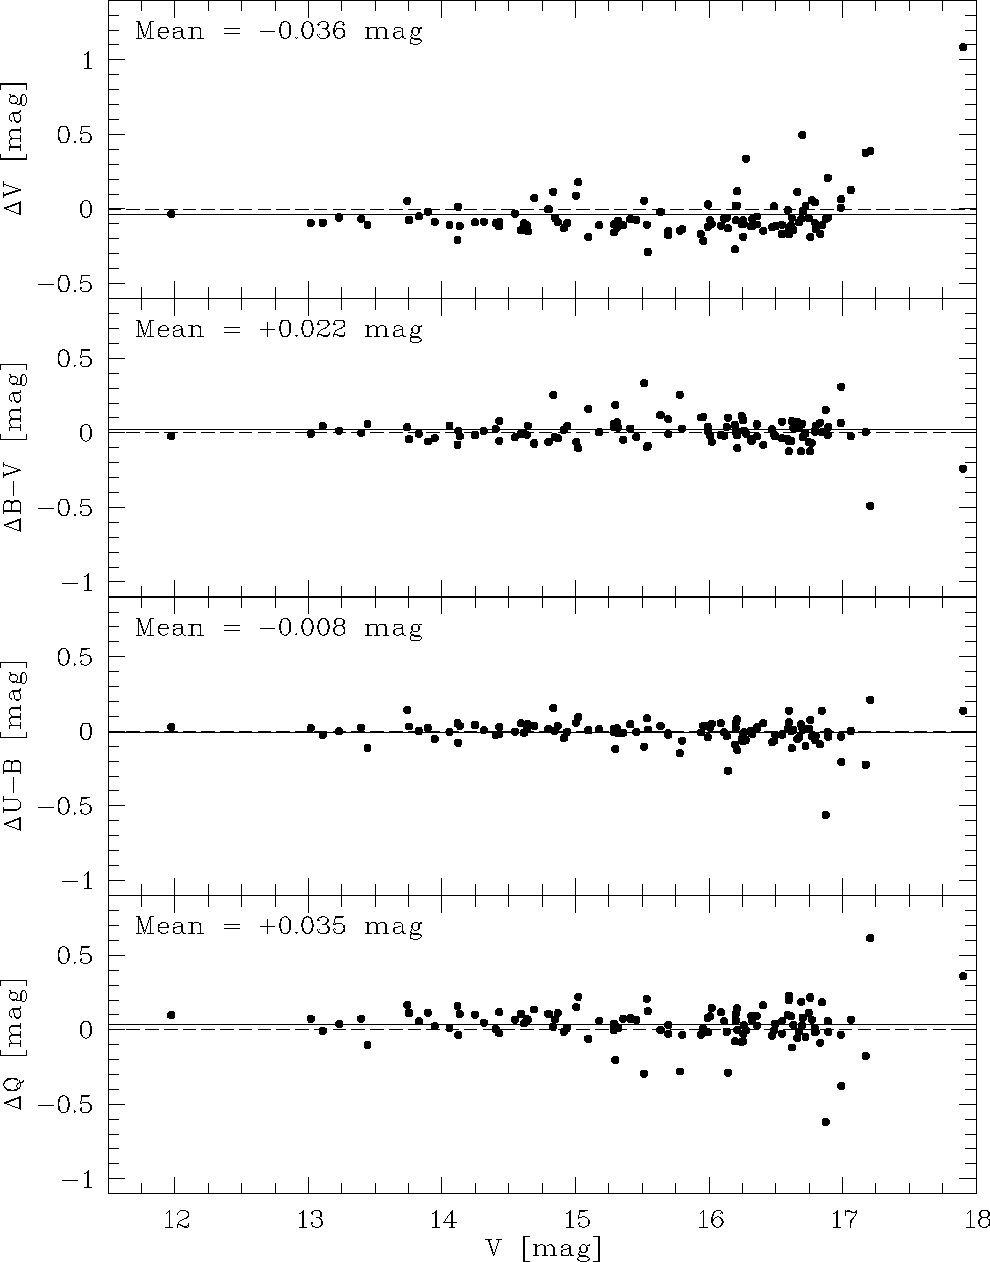
Figure 3: Comparison of our photometry with that from Lee (1990).
Mean values for the differences of V magnitudes,
B-V and U-B colours, and for the
reddening free parameter Q are given and indicated by the
solid line. All differences are in the sense our value minus
Lee's value. Zero differences are indicated by dashed lines
The quality of the photometry and of the calibration has been checked
by comparison with the photometry of Lee (1990).
We could cross identify 122 stars for which V and B-V could be compared.
For 111 of these stars also U-B was available in both data sets.
Figure 3 (click here) shows the differences in V, B-V, U-B and the
reddening free parameter Q plotted against our V magnitude.
In V a significant difference of ![]() mag
is found.
The differences in the colours, especially in U-B, are smaller.
The differences are growing towards faint magnitudes since Lee's photometry is,
due to the smaller telescope he used, not as deep as ours.
mag
is found.
The differences in the colours, especially in U-B, are smaller.
The differences are growing towards faint magnitudes since Lee's photometry is,
due to the smaller telescope he used, not as deep as ours.
While our work on LH47 was in progress Oey & Massey (1995) published their photometry
of the association.
A comparison of both data sets
(432 stars in common for B and V, 426 stars for U),
revealed inconsistencies with the photometry of Oey & Massey (1995).
The main sequences in their two fields (LH47 and LH48)
do differ significantly (![]() mag) in B-V and U-B colours.
This leads to approximately the same amount of deviation from our photometry
(in B-V for LH47 and in U-B for LH48).
With our large CCD frames we cover in one frame
the main parts of the two fields of Oey & Massey (1995).
Strongly varying reddening over the area of the association cannot be found
in our data.
However, the problem is of that kind that the Q-values used by Oey & Massey (1995)\
are not affected for stars brighter than
mag) in B-V and U-B colours.
This leads to approximately the same amount of deviation from our photometry
(in B-V for LH47 and in U-B for LH48).
With our large CCD frames we cover in one frame
the main parts of the two fields of Oey & Massey (1995).
Strongly varying reddening over the area of the association cannot be found
in our data.
However, the problem is of that kind that the Q-values used by Oey & Massey (1995)\
are not affected for stars brighter than ![]() 15th magnitude and thus
their conclusions derived from their spectra together with the
Q-values are also not affected.
15th magnitude and thus
their conclusions derived from their spectra together with the
Q-values are also not affected.
For very hot stars the B-V colour is not a good indicator for the temperature any more (see e.g. Massey 1985; Massey et al. 1995a,b; Will et al. 1996). Thus, when fitting isochrones to very young stellar populations as LH47 with high turn off masses and no red supergiants, the age determination is quite difficult and uncertain. This is a bit better for the U-B colour but there the calibration is much more difficult and unreliable. Thus we decided to take spectra of the stars at the apparent top of the main sequence with the aim to distinguish evolved and non evolved stars, i.e. to determine luminosity classes. This should allow to fix the turn off point of the main sequence and thus would result in a better determination of the age of the association.
As target stars for spectroscopy we selected bright blue stars from the top of the main sequence. They were numbered according to decreasing brightness. Table 5 (click here) gives the coordinates and the photometric information of the target stars. Star #14 is missing, because after selecting the stars it turned out that this star has a close neighbour and thus it has not been observed. Stars #2 and #9 are present in the MACS. Star #2 is MACSJ0522-679#027 and star #9 is MACSJ0522-679#018. The coordinates for all other stars have been calculated from the cross identification with the MACS. Figure 4 (click here) shows the target stars on a V exposure of N44. In the CMD (Fig. 2 (click here)) the target stars for spectroscopy are marked by crosses. We observed spectra of these stars in the optical wavelength range for classification purposes and in the UV for the determination of temperatures by fitting model atmospheres.
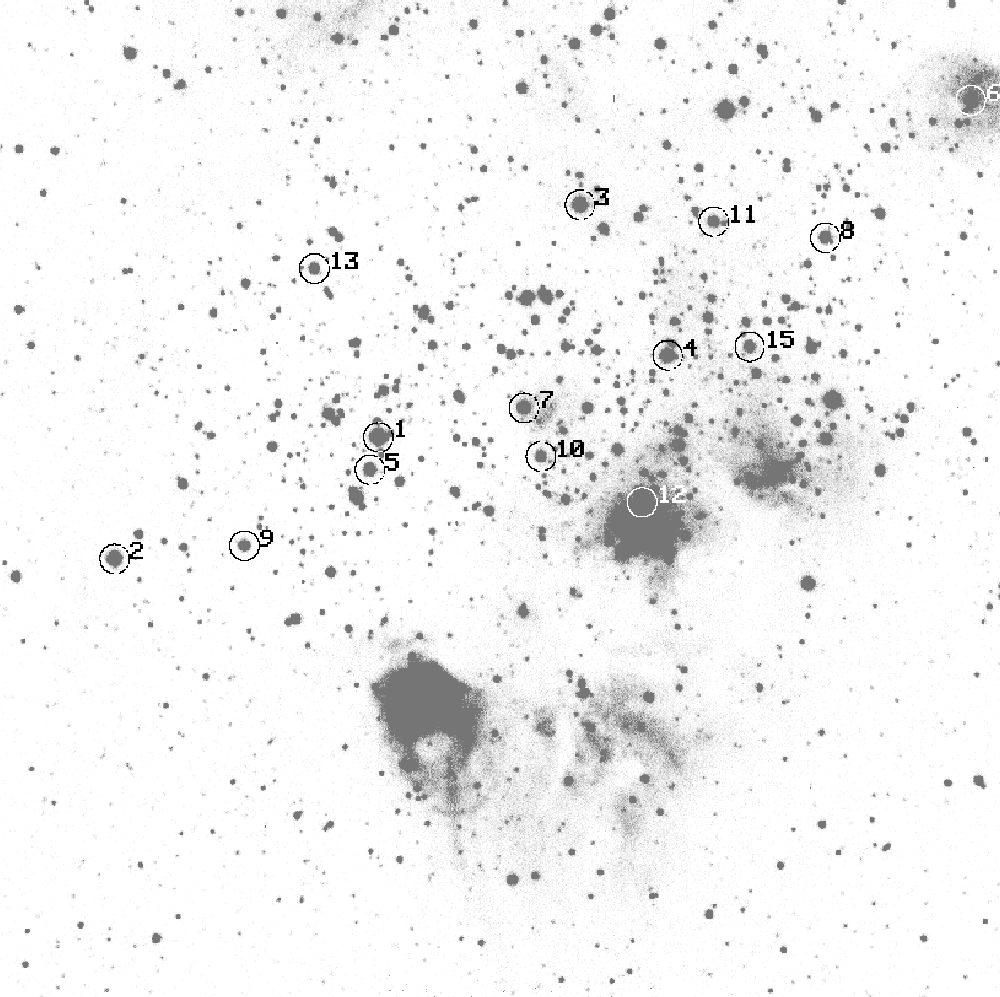
Figure 4: The target stars for spectroscopy marked on a V exposure of
N44.
North is up and east to the left.
The size of the field of view is ![]()
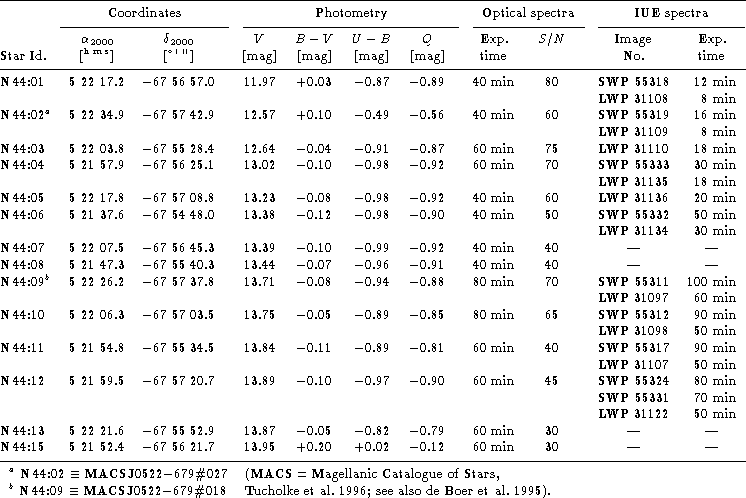
Table 5: Target stars for spectroscopy, their coordinates, photometric
information and the log of the optical and UV spectroscopy.
For the optical spectra exposure times and signal-to-noise
ratios are given, for the UV spectra the IUE image numbers
and the exposure times are given
Long slit spectra of the target stars in the optical wavelength range
have been observed with the B&C spectrograph at the 1.52 m telescope at ESO,
La Silla from 24th to 26th November 1993.
We used grating #28 which gives a dispersion of 64.5 Å/mm.
The detector was a Ford CCD (ESO #24) with ![]() pixel
pixel![]() of
of ![]() .
The slit width was
.
The slit width was ![]() on the sky.
The slit was always aligned in that way that two stars of similar
brightness were observed simultaneously.
The spectra cover the wavelength range from 3600 Å to 5500 Å\
with a resolution of 2.3 Å (determined from the FWHM of the lines
in the He-Ar calibration spectra).
Table 5 (click here) gives the exposure
times and the achieved signal-to-noise ratio.
on the sky.
The slit was always aligned in that way that two stars of similar
brightness were observed simultaneously.
The spectra cover the wavelength range from 3600 Å to 5500 Å\
with a resolution of 2.3 Å (determined from the FWHM of the lines
in the He-Ar calibration spectra).
Table 5 (click here) gives the exposure
times and the achieved signal-to-noise ratio.
The spectra have been reduced with MIDAS in a standard way. The wavelength calibration has been performed with He-Ar spectra which have been taken immediately before and after each stellar spectrum. No flux calibration has been performed, instead we normalized the spectra to unity. Figure 5 (click here) shows all 14 spectra.
Low resolution IUE spectra of 10 of the stars have been observed from 17th to 20th July 1995. We used the large aperture of the IUE. Observing details for these stars are given in Table 5 (click here). The spectra are shown in Fig. 6 (click here). They have been weakly smoothed with a 5 pixel median filter.