In order to accurately determine the limiting magnitude of the survey and the U-B threshold actually applied to the selection of quasar candidates, as well as to measure the positions and magnitudes of the candidates, we digitised, using MAMA, the dual-exposure Schmidt plate PS26671 in small fields surrounding each candidate.
MAMA (Machine Automatique à Mesurer pour l'Astronomie) is a high-speed and high-accuracy microdensitometer. It is operated by the Centre d'Analyse des Images (C.A.I.) located at Observatoire de Paris (Guibert & Moreau 1991). Technical characteristics of the scanning system are described elsewhere (Moreau 1992); they are summarized here:
For the measurement of the quasar candidates, MAMA was used in its pavés digitising mode
(Berger et al. 1991). In this random access mode, small images are acquired around each
object position given in a scanning list. The size of these pavés was chosen to be
![]() pixels, i.e.
pixels, i.e. ![]() arcsec on the sky. For the
scanned dual-exposure plate, each pavé contains two images of
the same object: one in each of the U and B bands. The two images
associated with each candidate were visually identified on screen displays
of the MAMA frames (using the VISUAL visualization software; see Vétois
1995) in order to ensure
their correct retrieval in the catalogue of detected objects.
arcsec on the sky. For the
scanned dual-exposure plate, each pavé contains two images of
the same object: one in each of the U and B bands. The two images
associated with each candidate were visually identified on screen displays
of the MAMA frames (using the VISUAL visualization software; see Vétois
1995) in order to ensure
their correct retrieval in the catalogue of detected objects.
The scanned images were digitally processed, as described in
Berger et al. (1991), for object detection. The images were segmented
(Rosenfeld 1969) at a fixed density value above the local sky background and we
considered as an object every domain of more than 9 connected pixels whose density is above this threshold.
A local value for the sky background was computed inside each of the pavés on the basis of density
histograms of the pixels. The corresponding standard deviation on each pixel,
![]() , was accordingly estimated in every pavé.
The threshold for segmentation of the images was set to
, was accordingly estimated in every pavé.
The threshold for segmentation of the images was set to ![]() above the local background, where
above the local background, where ![]() is the mean value on the plate of the "pixel-to-pixel" standard
deviations
is the mean value on the plate of the "pixel-to-pixel" standard
deviations ![]() . One should note that a few close
associations were not directly resolved by the deep segmentation we made,
and that the U and B images of some rather bright objects, thus having
a large area, did merge at this threshold. For some objects, the local
background was so polluted that measurements at
. One should note that a few close
associations were not directly resolved by the deep segmentation we made,
and that the U and B images of some rather bright objects, thus having
a large area, did merge at this threshold. For some objects, the local
background was so polluted that measurements at ![]() were not correct. For all these objects, we
then performed
several runs of our process with increasing values of the threshold
(up to
were not correct. For all these objects, we
then performed
several runs of our process with increasing values of the threshold
(up to ![]() ) to correctly extract them.
On the opposite, a few very faint objects were not detected at
) to correctly extract them.
On the opposite, a few very faint objects were not detected at
![]() ; in such a case, we also segmented the MAMA images at
; in such a case, we also segmented the MAMA images at ![]() .
.
The object detection process supplies a catalogue whose main entries are (X,Y) machine coordinates of the objects, their area (number of pixels inside the segmented contour), density flux (sum of the density values of the pixels above local background, expressed in MAMA quantification levels), local background value and morphological parameters including the ellipse axis parameters of the contour. The photometric and astrometric reduction of the produced object catalogues was conducted separately in each band using the procedure detailed in Berger et al. (1991); the main steps are displayed hereafter.
Dual-exposure plates are not well adapted to accurate machine photometric measurements. Indeed, they are
noisy because U and B backgrounds are superimposed on the same emulsion. Moreover, the type of
emulsion of the plate we used (103a-O) worsens the problem. However, we found essential to measure the
magnitudes of the candidates on the plate actually used for their selection.
Thus, the photometric accuracy on the U and B magnitudes presented
hereafter is not the best we can achieve on Schmidt plates digitised with MAMA (see for example
Moreau & Reboul 1995). Improved magnitudes, derived for other epochs, will be
available for objects of the field thanks to the systematic ![]() multicolour survey we are conducting (see Moreau et al. 1994).
multicolour survey we are conducting (see Moreau et al. 1994).
In order to calibrate the photographic plate, we used the specially acquired photometric sequence mentioned in Sect. 3.2. The stars of this sequence were included in the list of objects to scan in addition to the quasar candidates. The brighter stars cannot be used to calibrate dual-exposure plates, because the two images of these objects merge. They were however useful as intermediate standards during the set-up of the sequence.
The determination of the magnitudes of the candidates was performed through a log(flux)/magnitude calibration curve derived from a fit over the standard stars (where flux is the density flux defined in Sect. 4.2). The adopted polynomial calibration fits are displayed in Fig. 1 (click here) and we give in Table 4 (click here) further information: the domain of validity, the number of standard stars used and the obtained residuals (standard deviation of the fit). These residuals give an estimate of the photometric accuracy achieved, at least in non-peripheral regions of the plate and for objects brighter than about magnitude 19. We estimate that our U and B magnitude measurements are subject to a global standard deviation of about 0.15 mag. A photometric reduction has also been performed for each of the other segmentation thresholds that were used. It should be clear that the combination of the filters (see Table 1 (click here)) and of the emulsion only gives a poor approximation of the standard U and B bands. Thus, the present calibration is an approximation which is not fully correct, particularly for the case of quasars. No effort has been made to compute continuum (i.e. corrected for lines) magnitudes.
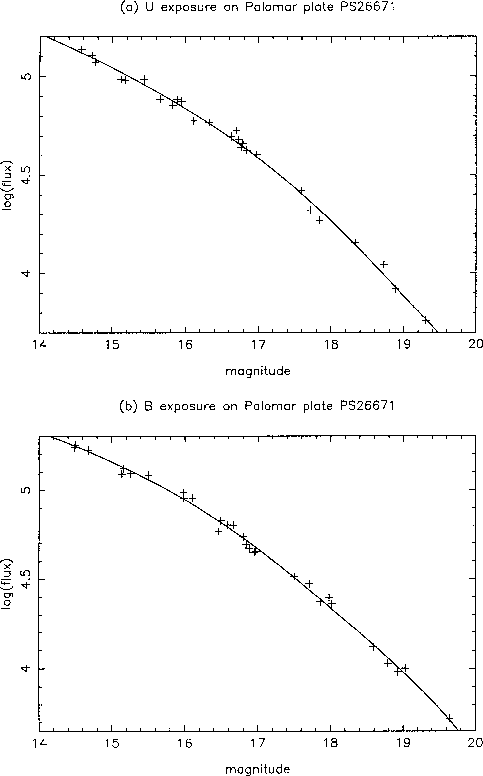
Figure 1: Photometric calibration curves for each of the U and B exposures

Table 4: Photometric calibration
Bright objects, as usually are the astrometric standard stars, see their two images merged on dual-exposure
plates. Performing high-precision astrometry on such a plate turned out to be extremely difficult. Therefore,
we measured the positions of the candidates on another plate, namely ESO8799. This classical single-
exposure B plate, obtained at ESO in the framework of our on-going ![]() systematic survey, was
also scanned in the pavés mode.
The astrometric reduction was done using a transformation from
systematic survey, was
also scanned in the pavés mode.
The astrometric reduction was done using a transformation from ![]() plate coordinates to (
plate coordinates to (![]() ,
,
![]() ) standard coordinates, through an
adjusted third order bidimensional polynomial, and then to (
) standard coordinates, through an
adjusted third order bidimensional polynomial, and then to (![]() ,
, ![]() ) equatorial coordinates,
through the classical inverse operation of the gnomonic
projection. The 20 coefficients of the polynomial (the plate constants)
were determined using proper-motion-corrected positions of 84 reference
stars from the PPM star catalogue (Röser & Bastian 1991),
expressed in standard coordinates via the gnomonic projection.
The residuals on the transformation were 0.34 arcsec
(standard deviation of the fit referring to one coordinate).
The positions of the objects lying close to the edges of the
field are expected to be measured less precisely; globally,
the achieved astrometric accuracy for these is estimated to be 0.5
arcsec. Note that a few very faint objects were not recovered
on the ESO plate; we give for them a slightly less precise
position determined on the dual-exposure Palomar plate.
) equatorial coordinates,
through the classical inverse operation of the gnomonic
projection. The 20 coefficients of the polynomial (the plate constants)
were determined using proper-motion-corrected positions of 84 reference
stars from the PPM star catalogue (Röser & Bastian 1991),
expressed in standard coordinates via the gnomonic projection.
The residuals on the transformation were 0.34 arcsec
(standard deviation of the fit referring to one coordinate).
The positions of the objects lying close to the edges of the
field are expected to be measured less precisely; globally,
the achieved astrometric accuracy for these is estimated to be 0.5
arcsec. Note that a few very faint objects were not recovered
on the ESO plate; we give for them a slightly less precise
position determined on the dual-exposure Palomar plate.

Table 5: Measurement repeatability tests
on the U and B images of the faint object ![]() (see Sect. 4.5)
(see Sect. 4.5)
The repeatability of the measurement chain (MAMA digitisation + object detection) was tested in extreme conditions, i.e. on a faint object measured on a noisy plate. In order to estimate the measurement internal errors, we successively scanned on the dual-exposure plate 12 times the same object, thus taking and analysing 12 different MAMA frames. We chose a faint object: #243 (a tertiary candidate at U = 18.6 and B = 19.2), so that the derived errors were not expected to be optimistic. The results are displayed in Table 5 (click here) where we give both the standard deviation and the maximal departure from the mean for the following quantities: X and Y plate coordinates of the object, its area and density flux. Object-position fluctuations have also been derived from the dispersions of X and Y combined via a distance calculation.
By inspecting the data, it is clear that fluctuations in position measurements are essentially related to fluctuations in the number of pixels of the object, and correspond to the passage, because of noise, of one or more pixels above or below the segmentation threshold. Obviously, the more an object has a large area i.e. - for star-like objects - is bright, the smaller are these fluctuations. On the contrary, flux fluctuations occur even with a constant number of pixels, because the density value of each pixel is affected by noise. In any case, the measured internal errors are rather small compared to the absolute accuracy we derived above. The standard deviations in flux correspond, after photometric reduction, to standard deviations of 0.05 mag in U and 0.02 mag in B, whereas the standard deviations in (X, Y) position correspond on the plate to 0.11 arcsec in U and 0.04 arcsec in B.