A small angular velocity vector ![]() leads to proper motion differences in the sense
leads to proper motion differences in the sense
![]()
(Fricke 1977; Brosche & Sinachopoulos 1987).
Since we have proper motion differences
![]() ,
, ![]() for each star, we are able to compute the
components of
for each star, we are able to compute the
components of ![]() by least-squares adjustment. We use both
components of the proper motion differences. Note that we
could also derive all components from
by least-squares adjustment. We use both
components of the proper motion differences. Note that we
could also derive all components from ![]() alone,
while the
alone,
while the ![]() allow to find
allow to find ![]() and
and
![]() only.
only.
In order to obtain the components ![]() from a least-squares fit to Eq.\
(1 (click here)), we can either use the proper motion differences star by star
or compute average proper motion differences
from a least-squares fit to Eq.\
(1 (click here)), we can either use the proper motion differences star by star
or compute average proper motion differences ![]() for each
field and use them in Eq. (1 (click here)). It is plausible that the
preference for one or the other side depends on whether or not the
errors in the proper motions are correlated between neighbouring
stars. In the following we discuss both strategies. In addition to
the weighting by proper motion errors, discussed in the respective
sections, the stars received a weight (using a simplified version of
the weighting scheme of Brosche et al. 1991) depending on their
positions, so that the weighted mean of their positions coincides with
the field centre. This diminishes the consequences of possible
systematic proper motion errors varying linearly with position on the
plate.
for each
field and use them in Eq. (1 (click here)). It is plausible that the
preference for one or the other side depends on whether or not the
errors in the proper motions are correlated between neighbouring
stars. In the following we discuss both strategies. In addition to
the weighting by proper motion errors, discussed in the respective
sections, the stars received a weight (using a simplified version of
the weighting scheme of Brosche et al. 1991) depending on their
positions, so that the weighted mean of their positions coincides with
the field centre. This diminishes the consequences of possible
systematic proper motion errors varying linearly with position on the
plate.
Originally the number of H37Cr stars in common with our data set was 91.
However, some of these stars had large differences to the rotation
solution when compared to their internal errors. We excluded the most
deviant stars by the following method. We built all possible pairs of stars
and computed rotation solutions without these pairs. The solutions were sorted
by increasing standard deviation ![]() . When the exclusion of a certain
star led consistently to the lowest
. When the exclusion of a certain
star led consistently to the lowest ![]() 's in all combinations with other
stars, this star was definitely omitted. This method is repeated with the
new set of N-1 stars, until no further candidate for exclusion is found.
Simulations using the actual coordinates and absolute proper motions, but
an artificial rotation and a normal distribution of errors, demonstrated that
this method (1) detects stars deviating from the mean solution by more than
about
's in all combinations with other
stars, this star was definitely omitted. This method is repeated with the
new set of N-1 stars, until no further candidate for exclusion is found.
Simulations using the actual coordinates and absolute proper motions, but
an artificial rotation and a normal distribution of errors, demonstrated that
this method (1) detects stars deviating from the mean solution by more than
about ![]() , (2) isolates deviant stars clearer than simply looking
at the individual
, (2) isolates deviant stars clearer than simply looking
at the individual ![]() 's.
's.
We excluded a total of three stars - one each in the fields of 3C 390.3, M3, and 3C 345. All except the star in the 3C 390.3 field lie very close to the respective field border, making their astrometry somewhat doubtful. None of these stars has an a-priori probability to be an undetected astrometric binary (see Sect. 4.1) above the average. The results reported in this article are based on the remaining 88 stars.
We define ![]() ,
, ![]() as the proper motion differences
in the sense Hipparcos minus extragalactic. Each proper motion
difference enters with a weight
as the proper motion differences
in the sense Hipparcos minus extragalactic. Each proper motion
difference enters with a weight ![]() into the solution of Eq. (1 (click here)), where
into the solution of Eq. (1 (click here)), where ![]() and
and ![]() are the internal errors of the proper motion components from our
measurements and H37Cr, respectively.
are the internal errors of the proper motion components from our
measurements and H37Cr, respectively.
The solution of Eq. (1 (click here)) leads to an angular velocity vector,
which brings the H37Cr proper motions to our extragalactically
calibrated system. Since H37Cr is an intermediary solution which
is not generally available, the angular velocity vector ![]() given here is the difference between our solution and the mean
rotation adopted for the final Hipparcos catalogue by Kovalevsky
et al. (1996). The errors are the formal errors of our solution
(compare also Sect. 5 and Eq. (6 (click here))):
given here is the difference between our solution and the mean
rotation adopted for the final Hipparcos catalogue by Kovalevsky
et al. (1996). The errors are the formal errors of our solution
(compare also Sect. 5 and Eq. (6 (click here))):
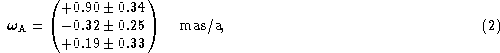
with a standard deviation ![]() mas/a of a single proper motion
component of one star.
mas/a of a single proper motion
component of one star.
When we correct the H37Cr proper motions to our extragalactic system,
the mean of the residual differences (O-C) to our values is zero. We
define the individual normalized residuals for star i as ![]() . The
. The ![]() of
the solution is then simply
of
the solution is then simply ![]() . In this case we find
. In this case we find
![]() for
for ![]() degrees of freedom, combining both
proper motion components. The probability p that this
degrees of freedom, combining both
proper motion components. The probability p that this ![]() or a
larger one arises by chance is smaller than 3
or a
larger one arises by chance is smaller than 3 ![]() , so that it
is certain that either a simple rotation is not a sufficient model or
the errors are underestimates.
, so that it
is certain that either a simple rotation is not a sufficient model or
the errors are underestimates.
As a numerical exercise, we test how much we would have to increase
the H37Cr errors in order to achieve reasonable values of ![]() . When
we replace all
. When
we replace all ![]() by
by ![]() with b=1.42, we have
with b=1.42, we have
![]() with a probability of 0.44. For b=1.29 we arrive at
with a probability of 0.44. For b=1.29 we arrive at
![]() , which leads to an already acceptable p=0.073.
Similarly, when keeping constant the internal H37Cr errors, we would have to
multiply all internal errors of our proper motions by 1.37 in order to
achieve a
, which leads to an already acceptable p=0.073.
Similarly, when keeping constant the internal H37Cr errors, we would have to
multiply all internal errors of our proper motions by 1.37 in order to
achieve a ![]() similar to the degrees of freedom.
similar to the degrees of freedom.
The symmetric correlation matrix of the angular velocity components is
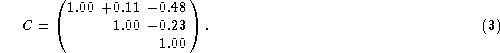
The element ![]() results from the
covariance matrix A by
results from the
covariance matrix A by ![]() . These significant
correlations result from the uneven
distribution of the link fields over the sphere. Simulations have shown,
however, that the rotation components are
recovered within their internal errors in spite of the correlations.
. These significant
correlations result from the uneven
distribution of the link fields over the sphere. Simulations have shown,
however, that the rotation components are
recovered within their internal errors in spite of the correlations.
We compute weighted average proper motion differences
![]() and
and ![]() for each field,
using the internal proper motion errors for the weights. The field of
3C 390.3, were only one star could be used, was excluded, so that we
are left with 12 fields for this solution. With these mean
differences we solve Eq. (1 (click here)), using the mean coordinates
for each field,
using the internal proper motion errors for the weights. The field of
3C 390.3, were only one star could be used, was excluded, so that we
are left with 12 fields for this solution. With these mean
differences we solve Eq. (1 (click here)), using the mean coordinates
![]() and
and ![]() from Table 1 (click here) and weights
from Table 1 (click here) and weights
![]() .
.
The difference between the resulting rotation and the adopted rotation for
the final Hipparcos catalogue (Kovalevsky et al. 1996) is
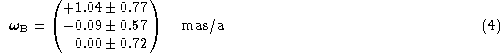
with a standard deviation ![]() mas/a
of a single mean proper motion component of one field.
The difference between the two versions of
mas/a
of a single mean proper motion component of one field.
The difference between the two versions of
![]() is comfortably within the combined errors:
is comfortably within the combined errors:
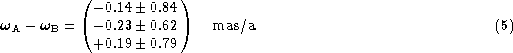
![]()
Figure 2:
The residuals in proper motion in ![]() (upper panel) and
(upper panel) and ![]() (lower panel) after the rotation solution from individual stars are
plotted as small symbols versus B magnitude from the Hipparcos Input
Catalogue (INCA). Bold symbols are the mean residuals for 13
stars each, where the error bars are mean errors of the mean
(lower panel) after the rotation solution from individual stars are
plotted as small symbols versus B magnitude from the Hipparcos Input
Catalogue (INCA). Bold symbols are the mean residuals for 13
stars each, where the error bars are mean errors of the mean
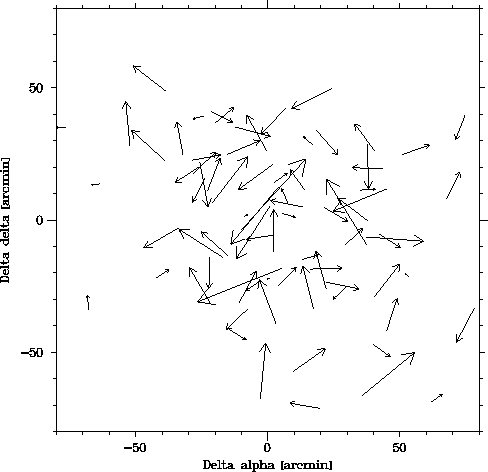
Figure 3:
Residuals from the rotation solution using individual stars, plotted at the
locations of the stars relative to the field centre, combined for all 13
fields. Coordinates are given in arc minutes relative to the field
centre. No systematic trends of the residuals with position in the fields
can be discerned
In Fig. 2 (click here) we display the magnitude dependence of the
residuals from the rotation solution using individual data
(Eq. 2 (click here)). We chose the B magnitude, since most of the
photographic plates were taken with a blue-sensitive emulsion. The
Hipparcos Input Catalogue (Turon et al. 1992) served as source for the
magnitudes. Bold symbols show the mean residuals for 13 stars
each. While the naked eye cannot discern any dependence on B for
single or mean residuals, weighted least-squares fits of straight
lines result in moderately significant slopes of ![]() mas/a/mag in
mas/a/mag in ![]() and
and ![]() mas/a/mag in
mas/a/mag in ![]() . From the
appearence of Fig. 2 (click here) it is far from clear whether a
straight line or some other functional dependence should be applicable
in this case. Accordingly, we did not apply any correction for a
systematic change of the proper motions with magnitude.
. From the
appearence of Fig. 2 (click here) it is far from clear whether a
straight line or some other functional dependence should be applicable
in this case. Accordingly, we did not apply any correction for a
systematic change of the proper motions with magnitude.
We also tested for systematic dependences of the residuals in ![]() and
and ![]() on colour, right ascension, declination, or distance from
the field centre. We did not detect any systematic behaviour in the
respective plots. As an example, we plot in Fig. 3 (click here) the
residuals as small arrows versus the projected distances from the
respective field centres. No systematic pattern appears. This still
holds if one plots the fields individually.
on colour, right ascension, declination, or distance from
the field centre. We did not detect any systematic behaviour in the
respective plots. As an example, we plot in Fig. 3 (click here) the
residuals as small arrows versus the projected distances from the
respective field centres. No systematic pattern appears. This still
holds if one plots the fields individually.
Since the residuals are independent of position in the field, there is no need to create an average proper motion difference Hipparcos minus extragalactic for each field, in order to suppress such errors. This is the main reason for our choice of the rotation solution using individual stars (Eq. 2 (click here)) instead of that from field means (Eq. 4 (click here)) as our final result.