The instrument performance was derived by means of various tests performed at different levels. Functional tests on the most critical items were performed at component level (phoswich units, FCS, shield assembly, collimators, PSA). Preliminary results of the functional tests have already been reported (Frontera et al. 1997).
The instrument calibration was performed in successive steps. First the Core Assembly (detection plane plus FCS) was separately calibrated from the Shield Assembly (top shield plus lateral shield plus MCS) and rocking collimators. The rocking collimators were not integrated in the detector in order to irradiate each phoswich detection unit with almost uniform X-ray beams obtained with radioactive sources at a distance of 1.8 m (see Sect. 3.2 (click here)).
Then the core assembly was integrated with the shield assembly with MCS source not mounted. A new calibration of the detection plane was then performed and compared with the previous one. Comparing the line intensities measured with this calibration with the corresponding ones measured before, we were capable to get an experimental verification of the expected X-ray transparency of the top shield.
Then the rocking collimators were integrated with the detector. In this configuration the CsI(Na) slabs of the lateral shields and the plastic scintillator of the top shield were calibrated. Also the AC thresholds, the AC decision time, the pulse height thresholds, the rise time thresholds for selecting NaI events were calibrated and set. The background level was also accurately measured. Finally the MCS source was mounted in its frame and more calibrations were performed and compared with the previous ones. The detector contamination by MCS source, its background behaviour as a function of the collimator rocking angle and MCS count rate as a function of the collimator offset were investigated.
AGC performance was investigated during the first calibration campaign. After that, it was continuously used during the subsequent calibration tests.
During all the calibration tests, the flight electronic unit was used. Events from the phoswich units were all acquired in direct mode, with the maximum information associated to each event (see Sect. 2.7 (click here)). In addition all the other available HK information were acquired. The encoded data from the experiment were sent to a simulator of the BeppoSAX OBDH and then to a mass memory. In parallel, the encoded data from the OBDH simulator were acquired by a PDS dedicated computer system (Dal Fiume et al. 1994, 1995) for an on-line filing of the data, quick look display, scientific analysis and archiving.
In order to derive the response function of the PDS instrument, in addition to
the calibration tests, a Monte Carlo code based on EGS4 (Nelson et al. 1985)
was developed. The geometry described in the simulation of the detector
included the top shield assembly, the four phoswich units including the quartz
light guides, and the entrance window composition and the four Lateral Shields.
The X-ray interactions simulated by EGS4 code include photoelectric
absorption, Compton scattering, K-fluorescence production and transport. All
photons were followed down to 5 keV. The transport of the electrons produced in
the photon interactions was also included down to a minimum energy of 10 keV.
Finally the electronic analysis of the light pulses was calculated to
reproduce the pulse-shape analysis and energy spectra. The pulse-shape
distribution was reproduced assuming a Poisson statistics of the light
decay-time of the scintillators and calculating the variance and covariance of
the electronic outputs. For the energy spectra the measured calibration and
resolution was used. We assumed for the NaI(Tl) scintillation an exponential
time distribution with decay constant of ![]() , while for the CsI(Na) we
assumed the weighted sum of two exponential functions with decay constants of
, while for the CsI(Na) we
assumed the weighted sum of two exponential functions with decay constants of
![]() and
and ![]() , respectively (Bleeker & Overtoom 1979). These values
are suitable to describe the scintillations at room temperature.
, respectively (Bleeker & Overtoom 1979). These values
are suitable to describe the scintillations at room temperature.
In this way we can compare the calibration spectra measured with the expected ones as will be discussed in Sect. 3.3.3 (click here).
The radioactive sources used for the experiment calibration included
![]() ,
, ![]() ,
, ![]() ,
, ![]() and
and
![]() ,
, ![]() ,
,
![]() and
and ![]() . They were contained in proper wells of Lead that
acted as beam collimators. Each of these sources was preliminary calibrated
with their collimator, by using an ORTEC HPGe detector with a diameter of 25
mm, a sensitive thickness of 13 mm and a X-ray entrance window of Beryllium
0.254 mm thick. This preliminary calibration permitted to detect all the
. They were contained in proper wells of Lead that
acted as beam collimators. Each of these sources was preliminary calibrated
with their collimator, by using an ORTEC HPGe detector with a diameter of 25
mm, a sensitive thickness of 13 mm and a X-ray entrance window of Beryllium
0.254 mm thick. This preliminary calibration permitted to detect all the
![]() -ray lines (nuclear, fluorescence lines) with their intensity emitted
from the above sources and the presence of very low level X-ray fluorescence
from beam collimators.
-ray lines (nuclear, fluorescence lines) with their intensity emitted
from the above sources and the presence of very low level X-ray fluorescence
from beam collimators.
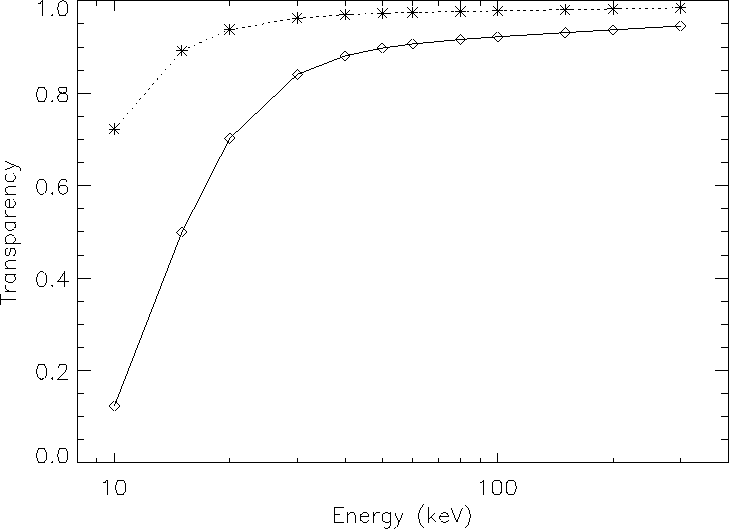
Figure 3: Transparency of the detection plane window as a function of the
photon energy. Dashed line: top shield window transparency. Full line: PHW
composite window transparency
The whole transparency of the detection plane windows (phoswich window and top shield window) as a function of the photon energy was determined from the knowledge of the material composition and thickness and it is shown in Fig. 3 (click here). Also shown in this figure is the computed transparency of the top shield window alone. The test results were in complete agreement with the values shown. The absorption coefficients were taken from the EGS4 code data tables (Nelson et al. 1985).

Figure 4: X-ray absorption efficiency of the NaI(Tl) detection units times
the X-ray entrance window transparency. Dashed line: only photoelectric
absorption. Full line: total absorption
The X-ray absorption efficiency of the NaI(Tl) detectors is defined as
![]() , where
, where ![]() is the total absorption
coefficient of the crystal and t its thickness. The absorption efficiency
times the transparency of the PHW X-ray entrance window is shown in
Fig. 4 (click here). The thickness t was measured. The PDS detection
efficiency is also dependent on the pulse shape thresholds selected, as it will
appear from the next section.
is the total absorption
coefficient of the crystal and t its thickness. The absorption efficiency
times the transparency of the PHW X-ray entrance window is shown in
Fig. 4 (click here). The thickness t was measured. The PDS detection
efficiency is also dependent on the pulse shape thresholds selected, as it will
appear from the next section.
The pulse shape analysis is of key importance for the experiment performance.
The PSA discrimination capability is very satisfactory as can be seen from
Fig. 5 (click here), that shows a pseudo image (pulse height channel PHA
versus PSA channel) of the ![]() radioactive source (nuclear line at 279
keV, plus Tl K-fluorescence lines at
radioactive source (nuclear line at 279
keV, plus Tl K-fluorescence lines at ![]() and
and ![]() keV). It is
apparent the separation of the good events due to NaI(Tl) scintillations (on
the left) from CsI(Na) scintillations (on the right) and mixed events (in the
middle).
keV). It is
apparent the separation of the good events due to NaI(Tl) scintillations (on
the left) from CsI(Na) scintillations (on the right) and mixed events (in the
middle).

Figure 5: A pseudo image of the ![]() radioactive
source (nuclear line at
279 keV), plus fluorescence X-ray lines at lower energies due to Tl produced
in the Hg decay, and to Lead of the source collimator. It is apparent the
separation of good events due to NaI(Tl) scintillation (on the left) from
events due to CsI(Na) scintillation. It is also apparent a bridge connecting
the peaks, corresponding to energy losses in the NaI(Tl) and CsI(Na),
respectively. This is due to photons that deposit part of their energy in NaI
and part in CsI
radioactive
source (nuclear line at
279 keV), plus fluorescence X-ray lines at lower energies due to Tl produced
in the Hg decay, and to Lead of the source collimator. It is apparent the
separation of good events due to NaI(Tl) scintillation (on the left) from
events due to CsI(Na) scintillation. It is also apparent a bridge connecting
the peaks, corresponding to energy losses in the NaI(Tl) and CsI(Na),
respectively. This is due to photons that deposit part of their energy in NaI
and part in CsI
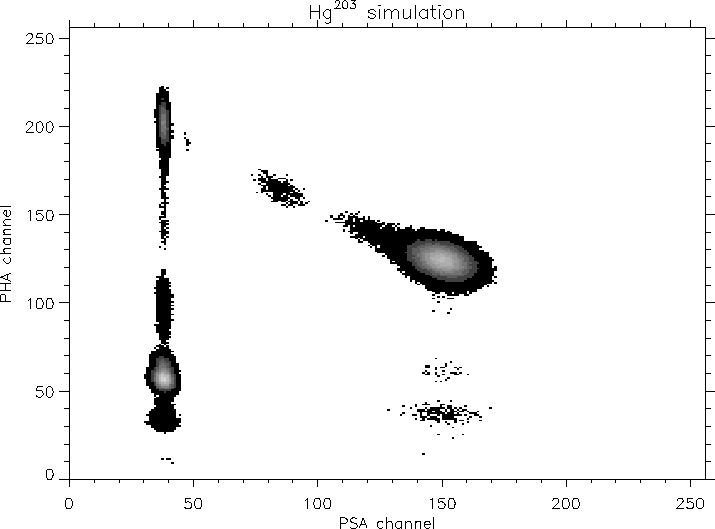
Figure 6: A pseudo image obtained with a Monte Carlo simulation
corresponding to the ![]() radioactive source. It is apparent the
similarity with Fig. 5 (click here), apart from the lowest energy (9-15 keV) photons
pulse shape distribution. This deviation is mainly due to electronic noise.
Instead is apparent in both the data and simulation images the bridge due to
Compton scattering
radioactive source. It is apparent the
similarity with Fig. 5 (click here), apart from the lowest energy (9-15 keV) photons
pulse shape distribution. This deviation is mainly due to electronic noise.
Instead is apparent in both the data and simulation images the bridge due to
Compton scattering
Figure 6 (click here) shows the corresponding pseudo image obtained with the Monte Carlo code. It is apparent the similarity of the images apart from an apparent deviation of the measured pulse shape distribution from that obtained with the Monte Carlo code for low PHA channel values that correspond to photon energies in the band from 9-15 keV. This deviation is due to electronic noise. It is also apparent in the simulated pseudo-image the bridge connecting the two hot spots due to 279 keV photons. It is due to Compton interactions of the 279 keV photons that deposit part of their energy in the NaI crystal and part in the CsI crystal.
Figure 7 (click here) shows, for detection unit A, the PSA peak centroid
and width (![]() FWHM) of NaI and CsI crystals as a function of the PHA
channel as derived from background measurements. The measurements were obtained
at two different temperatures and the separation is very good in both cases.
It can be also seen that the centroid position for both crystals is a function
of crystal temperature. For the NaI(Tl) we find results consistent with those
found in literature (Schweitzer & Ziehl 1983).
FWHM) of NaI and CsI crystals as a function of the PHA
channel as derived from background measurements. The measurements were obtained
at two different temperatures and the separation is very good in both cases.
It can be also seen that the centroid position for both crystals is a function
of crystal temperature. For the NaI(Tl) we find results consistent with those
found in literature (Schweitzer & Ziehl 1983).
Good events are selected by choosing an electronic digital window around ``pure'' NaI events. Given the dependence of the pulse shape peaks on temperature and, at a lower extent, on energy (see Fig. 7 (click here)), the window selection can affect the detection efficiency. A too narrow window could decrease the detection efficiency, while a broad window could include many Compton events and thus introduce systematic errors in the spectral reconstruction besides increasing the telescope background level. Actually with our Monte Carlo code we can take into account Compton interactions, single and multiple, and thus obtain an unbiased spectral reconstruction.
A default PSA window (channels 1-70) was chosen to derive the calibration results we report in this paper.
The nuclear and fluorescence lines emitted from the available radioactive
sources, that have an energy below 300 keV, were used to derive the relation
between line photon energy and pulse amplitude of the detected
line centroids.
Figure 8 (click here) shows the net ![]() spectrum as detected by the
phoswich unit A. It is apparent the 14 keV line (on the left) in the detected
spectrum. In order to derive the above relation, we fit the source spectra
with one or the sum of more Gaussian functions, depending on line separation.
For the X-ray fluorescence line blends, we fit to the
spectral data the sum of
two Gaussian functions due to the
spectrum as detected by the
phoswich unit A. It is apparent the 14 keV line (on the left) in the detected
spectrum. In order to derive the above relation, we fit the source spectra
with one or the sum of more Gaussian functions, depending on line separation.
For the X-ray fluorescence line blends, we fit to the
spectral data the sum of
two Gaussian functions due to the ![]() and
and ![]() lines, not resolved
in our detector. In order to limit the number of free parameters, only the
lines, not resolved
in our detector. In order to limit the number of free parameters, only the
![]() line parameters (line centroid, intensity and FWHM) were left free,
while parameters of the other lines in the ``blend'' were derived as functions
of the free parameters, making use of tabulated nuclear spectroscopic data.
line parameters (line centroid, intensity and FWHM) were left free,
while parameters of the other lines in the ``blend'' were derived as functions
of the free parameters, making use of tabulated nuclear spectroscopic data.
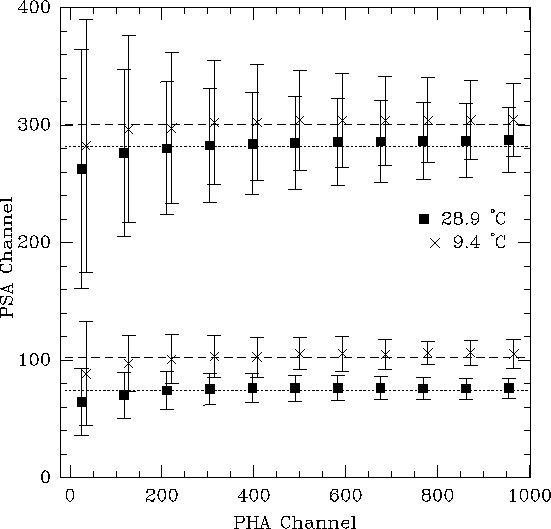
Figure 7: Position of the pulse shape peaks of NaI and CsI crystals as a
function of the pulse height channel as derived from background measurements.
Squares (![]() ) and crosses (
) and crosses (![]() ) refer to measurement taken
at different temperatures. One error bar is equal to one FWHM of each
PSA peak
) refer to measurement taken
at different temperatures. One error bar is equal to one FWHM of each
PSA peak
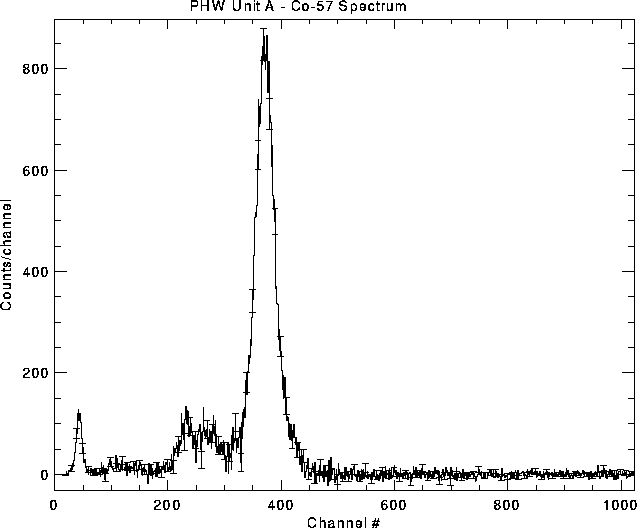
Figure 8: Background subtracted energy spectrum of the ![]() radioactive
source used during calibrations as seen by Unit A
radioactive
source used during calibrations as seen by Unit A
The derived relation between line centroid channel and photon energy is shown in Fig. 9 (click here) for each of the four phoswich units. The AGC, that was activated during all these tests, provided at 60 keV a gain equalization of the phoswich units within 1.5%. A better equalization (within 0.25%) was obtained during later tests at satellite level. A clear feature of the energy/channel curves is their almost similar behaviour up to 300 keV. This result was obtained thanks to quality control of the NaI(Tl) crystal production and to the fact that all the crystals were cut from the same ingot.
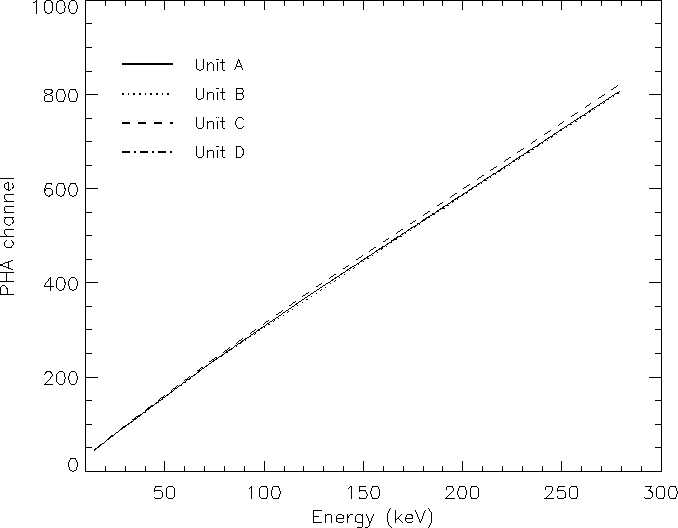
Figure 9: The derived relation between PHA line centroid channel and photon
energy for the four PDS detection units
The non-linearity curve of each NaI(Tl) crystal as a function of photon
energy, normalized to 279 keV ![]() line, is shown in
Fig. 10 (click here). The curves are in agreement with the expected
behaviour of a crystal 3 mm thick (see, e.g., Leo 1987). A detailed
investigation of the non-linearity of the NaI(Tl) around the Iodine K-edge
(33.170 keV) was not possible using only the available radioactive sources. We
plan to perform a thorough investigation of the NaI(Tl) crystal non linearity
with the PDS flight spare, whose crystals were cut from the same ingot as the
flight model.
line, is shown in
Fig. 10 (click here). The curves are in agreement with the expected
behaviour of a crystal 3 mm thick (see, e.g., Leo 1987). A detailed
investigation of the non-linearity of the NaI(Tl) around the Iodine K-edge
(33.170 keV) was not possible using only the available radioactive sources. We
plan to perform a thorough investigation of the NaI(Tl) crystal non linearity
with the PDS flight spare, whose crystals were cut from the same ingot as the
flight model.

Figure 10: The non-linearity curve of each NaI(Tl) crystal as a function of
photon energy, normalized to the 279 keV ![]() line
line
The instrument energy resolution (![]() where
where ![]() is
the FWHM of the Gaussian that fits the detected nuclear line of energy E) was
derived by using the same source spectra and results obtained to derive the
energy/channel relationship. The behaviour of the energy resolution versus
energy of one detection unit is shown in Fig. 11 (click here). As can be
seen, the data are not fit with a unique power law
is
the FWHM of the Gaussian that fits the detected nuclear line of energy E) was
derived by using the same source spectra and results obtained to derive the
energy/channel relationship. The behaviour of the energy resolution versus
energy of one detection unit is shown in Fig. 11 (click here). As can be
seen, the data are not fit with a unique power law ![]() with
with ![]() as expected if the scintillator exhibited a linear
response up to 300 keV. A broken power law can better fit the data. Actually it
is known (Sakai 1987) that the NaI(Tl) scintillators show a deviation from the
as expected if the scintillator exhibited a linear
response up to 300 keV. A broken power law can better fit the data. Actually it
is known (Sakai 1987) that the NaI(Tl) scintillators show a deviation from the
![]() above 100 keV, due to a combined effect of non-linear light output
with multiple interactions in the scintillator. In addition we verified
(Frontera et al. 1997) that PDS crystal gain is slightly dependent on photon
interaction position across the crystal. This can also affect the energy
resolution for high energies where the fractional variation due to Poisson
statistics is lower. At 60 keV the average energy resolution of the phoswich
units is slightly better than 15%.
above 100 keV, due to a combined effect of non-linear light output
with multiple interactions in the scintillator. In addition we verified
(Frontera et al. 1997) that PDS crystal gain is slightly dependent on photon
interaction position across the crystal. This can also affect the energy
resolution for high energies where the fractional variation due to Poisson
statistics is lower. At 60 keV the average energy resolution of the phoswich
units is slightly better than 15%.

Figure 11: The energy resolution of the detection unit B as a function of
energy. The slopes of two power laws are shown, too. The break occurs at
![]() keV
keV
The dependence of the energy resolution on High Voltage (HV) power supply of
the phoswich PMT was investigated to determine the interval of HV within which
the phoswiches can be operated. Results have already been reported (Frontera
et al. 1997). In a range of ![]() V around the nominal HV (corresponding to
1170- 1220 V depending on units) the energy resolution remains constant.
V around the nominal HV (corresponding to
1170- 1220 V depending on units) the energy resolution remains constant.
Figure 12 (click here) shows the spectrum acquired from the instrument during a
passage of the MCS source across the FOV. By comparing the parameters of the
122 keV line of the MCS source with those obtained when a uniform X-ray beam
was incident on the same unit (see Fig. 8 (click here)), we found that the
centroid positions and energy resolutions are consistent each other. The
typical time duration of a calibration test is ![]() s with live time of
the MCS source above each phoswich of 200 s. The count rate due to the 122 keV
line was
s with live time of
the MCS source above each phoswich of 200 s. The count rate due to the 122 keV
line was ![]() counts/s in March 1996. With this rate the peak centroid can
be evaluated with an accuracy of 0.1%.
counts/s in March 1996. With this rate the peak centroid can
be evaluated with an accuracy of 0.1%.

Figure 12: Background subtracted energy spectrum of the ![]() MCS
source as seen by Unit A
MCS
source as seen by Unit A
Due to the decay of the MCS source, the calibration time needed to get the same statistical quality of the data will change with time. After two years the time needed will be 6 times the initial one.
The effective area of the detector units is limited at lower energies by the overall composite window transparency discussed above and at high energies by the NaI(Tl) thickness. It also depends on energy resolution of the detectors and, through it, on incident photon spectrum. The effective area of the entire instrument as a function of energy is shown in Fig. 13 (click here), for two different input spectra (power law photon index equal to 1 and 2).
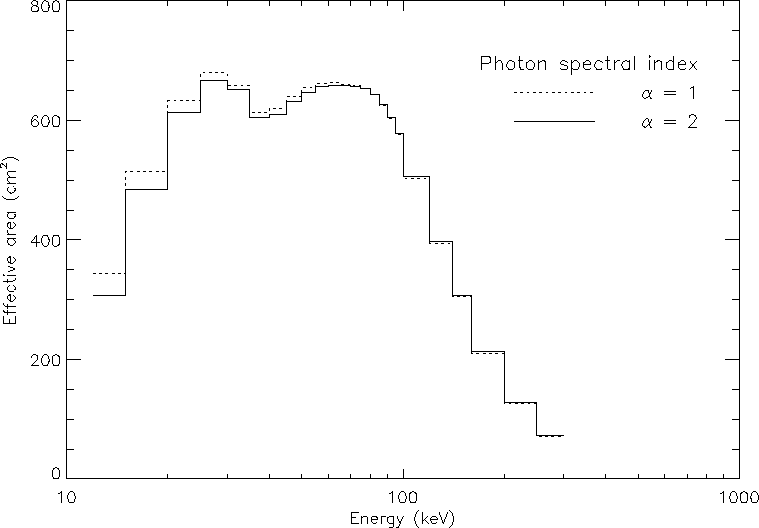
Figure 13: PDS Effective area as a function of photon energy. Two power law
incident photon spectra of the form ![]() have been simulated, with
photon indices
have been simulated, with
photon indices ![]() equal to 1 and 2
equal to 1 and 2
Great care was taken to minimize the PDS background level. Indeed, the detector
materials were selected with low residual radioactivity. The phoswich
technique provides an efficient active shielding of the NaI(Tl) detector over
2![]() solid angle, the lateral AC shielding system provides a rejection of
the unwanted photons and charged particles, the AC top shield provides an
efficient rejection of charged particles, in particular electrons.
solid angle, the lateral AC shielding system provides a rejection of
the unwanted photons and charged particles, the AC top shield provides an
efficient rejection of charged particles, in particular electrons.
Three background contamination components were identified: non tagged FCS source photons, residual X-ray fluorescence due to rocking collimator materials and contribution from gamma-ray lines of the MCS source. The overall contribution from the first two components gives rise to two main peaks in the background spectrum at 60 keV and 30 keV with an integrated count rate of about 0.3 counts/s per phoswich unit.
The third contamination component derives from photons produced by Compton interactions with the detector materials of weak high energy (> 300 keV) lines of the MCS source. The percentage integrated decay rate due to these lines is 0.18%. For comparison, the percentage decay rate of the 122 keV line is 85%. This contamination component will decay along with the MCS source decay. On the basis of the calibration tests performed in March 1995, this component will contribute with the following rates in September 1996, corresponding to the beginning of the BeppoSAX operative phase: unit A: 0.45 counts/s; unit B: 1.1 counts/s; unit C: 1.1 counts/s; unit D: 0.81 counts/s. As can be seen, different units are affected in different way, depending on their position with respect to the MCS source rest position.
The average background count rate/unit during the system tests at the launch facility
(March 1996) was about 2.5 counts/s, corresponding to ![]() counts/(
counts/(![]() s keV), in the range from 10 to 300 keV. Note that the area in
cm
s keV), in the range from 10 to 300 keV. Note that the area in
cm![]() refers to the detector geometric area.
refers to the detector geometric area.
No significant background modulation with the rocking collimator offset angle
was detected. The upper limit for this modulation, averaged on the entire
energy band, is < 2% (![]() ). A detailed calibration of background
modulation is foreseen during the scientific verification phase.
). A detailed calibration of background
modulation is foreseen during the scientific verification phase.