Following Cramer & Maeder (1979), we use here the reddening-free
parameters X and Y which have, as these authors showed, the optimum efficiency
for determining the effective temperature and the surface gravity respectively.
Although the definition of the X and Y parameters is given in several papers
(Cramer & Maeder 1979; NN90), we recall it here for
convenience:
![]()
![]()
where U, B1, B2, V1 and G stand for the Geneva colour indices [U-B],
[B1-B], [B2-B] etc. Let us recall that the Z parameter allows the
separation of the Bp stars (mostly of the Si and SiCr types)
from the normal B stars (Cramer & Maeder 1980);
it will not be used here, however.
The synthetic colours U, B1 etc. have been computed by one of us (BN) using
recent Kurucz models with scaled solar metallicities and a constant
microturbulent velocity ![]() (Kurucz
1993). The passbands used were those determined by Rufener &
Nicolet (1988). The X and Y parameters computed in this way are very
similar to those obtained for older models, because the additional line opacity
of the new models affects essentially the ultraviolet rather than the visible
part of the energy distribution. As before, these synthetic parameters do not
reproduce exactly the observations and should be corrected. However, we adopted
for this particular point another philosophy than that generally adopted to date
(Lester et al. 1986; Moon & Dworetsky 1985 etc.).
Instead of comparing the observed colour indices with those interpolated in the
``direct'' grids of synthetic colours from the known fundamental parameters, we
preferred to compare the fundamental physical parameters with those interpolated
in the inverted grid from the observed colours. Briefly, the inversion
of a grid implies an iterative, two-dimensional spline interpolation in the
``direct'' grid (where colours are given for regularly spaced values of
physical parameters like
(Kurucz
1993). The passbands used were those determined by Rufener &
Nicolet (1988). The X and Y parameters computed in this way are very
similar to those obtained for older models, because the additional line opacity
of the new models affects essentially the ultraviolet rather than the visible
part of the energy distribution. As before, these synthetic parameters do not
reproduce exactly the observations and should be corrected. However, we adopted
for this particular point another philosophy than that generally adopted to date
(Lester et al. 1986; Moon & Dworetsky 1985 etc.).
Instead of comparing the observed colour indices with those interpolated in the
``direct'' grids of synthetic colours from the known fundamental parameters, we
preferred to compare the fundamental physical parameters with those interpolated
in the inverted grid from the observed colours. Briefly, the inversion
of a grid implies an iterative, two-dimensional spline interpolation in the
``direct'' grid (where colours are given for regularly spaced values of
physical parameters like ![]() and log g) and results in an
``inverted'' grid giving the physical parameters for regularly spaced values
of the photometric parameters. In other words, we first invert the
grid of the synthetic X and Y parameters once and for all, following the
method described by NN90; then, we obtain for the standard stars
interpolated physical parameters, which can be compared with the fundamental
ones. For effective temperature, we use the quantity
and log g) and results in an
``inverted'' grid giving the physical parameters for regularly spaced values
of the photometric parameters. In other words, we first invert the
grid of the synthetic X and Y parameters once and for all, following the
method described by NN90; then, we obtain for the standard stars
interpolated physical parameters, which can be compared with the fundamental
ones. For effective temperature, we use the quantity
![]() rather than
rather than ![]() itself because
itself because
![]() varies linearly with the X parameter and the
range of
varies linearly with the X parameter and the
range of ![]() is large. In this way, the rms scatter around the
mean trend is roughly constant, while it would vary strongly if we used
is large. In this way, the rms scatter around the
mean trend is roughly constant, while it would vary strongly if we used
![]() directly; this is much safer from the point of view
of the least-squares fit, and is equivalent to give a lower weight to the
high effective temperatures. We obtain
directly; this is much safer from the point of view
of the least-squares fit, and is equivalent to give a lower weight to the
high effective temperatures. We obtain
![]()
and we plot ![]() vs.
vs. ![]() in Fig. 1 (click here). The trend can be fitted by a straight horizontal line in the
present case, because the slope indicated by the least-squares method is
smaller than its uncertainty. The interpolated reciprocal
effective temperature will then be corrected using the formula:
in Fig. 1 (click here). The trend can be fitted by a straight horizontal line in the
present case, because the slope indicated by the least-squares method is
smaller than its uncertainty. The interpolated reciprocal
effective temperature will then be corrected using the formula:
![]()
where ![]() stands for the interpolated value of
stands for the interpolated value of ![]() .
The advantage of this method over the previous one is that the grids need
to be inverted only once, while different corrections can be tried thereafter,
for example as new fundamental data are published. The fundamental stars are
those used by NN90, supplemented by new data from Adelman
(1988) and Adelman et al. (1993). The Adelman effective
temperatures cannot be considered as purely fundamental because they are
partly based on a comparison between the
observed energy distribution and a theoretical one. However, the Balmer lines
were also used to estimate these temperatures, which appear a posteriori
quite consistent with the purely fundamental ones of Code et al.
(1976). In any case, these temperatures are evidently independent from any
possible systematic error in the passbands of the Geneva system.
.
The advantage of this method over the previous one is that the grids need
to be inverted only once, while different corrections can be tried thereafter,
for example as new fundamental data are published. The fundamental stars are
those used by NN90, supplemented by new data from Adelman
(1988) and Adelman et al. (1993). The Adelman effective
temperatures cannot be considered as purely fundamental because they are
partly based on a comparison between the
observed energy distribution and a theoretical one. However, the Balmer lines
were also used to estimate these temperatures, which appear a posteriori
quite consistent with the purely fundamental ones of Code et al.
(1976). In any case, these temperatures are evidently independent from any
possible systematic error in the passbands of the Geneva system.
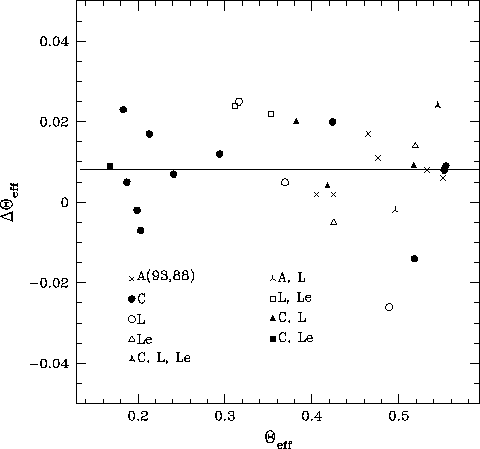
Figure 1: Difference between interpolated and fundamental
![]() values vs. fundamental
values vs. fundamental ![]() for the hot stars. The fitted
horizontal line is shown; see Table 1 for the key to the symbols
for the hot stars. The fitted
horizontal line is shown; see Table 1 for the key to the symbols
The fundamental ![]() values are listed in Table 5 (click here), together with the
interpolated and corrected values. The uncertainties of the fundamental values
are quoted from their authors, while those of the interpolated values are
estimated from the photometric errors (for a photometric weight P = 1), as
described in NN90. The
values are listed in Table 5 (click here), together with the
interpolated and corrected values. The uncertainties of the fundamental values
are quoted from their authors, while those of the interpolated values are
estimated from the photometric errors (for a photometric weight P = 1), as
described in NN90. The ![]() and
and ![]() values obtained from the observed colours by interpolation in the
corrected grids are compared with their respective fundamental values
in Figs. 2 (click here)a and 2 (click here)b.
values obtained from the observed colours by interpolation in the
corrected grids are compared with their respective fundamental values
in Figs. 2 (click here)a and 2 (click here)b.
![]()
Figure 2: a) Difference between photometric and fundamental
![]() values vs. the X parameter. The continuous line is the mean
while the broken lines define the average rms scatter; see Table 1 for the key
to the symbols. b) Same as a), but for
values vs. the X parameter. The continuous line is the mean
while the broken lines define the average rms scatter; see Table 1 for the key
to the symbols. b) Same as a), but for ![]() . The
horizontal line is arbitrarily set to zero. Notice the
large increase of the scatter towards small values of X, i.e. towards the
hotter stars
. The
horizontal line is arbitrarily set to zero. Notice the
large increase of the scatter towards small values of X, i.e. towards the
hotter stars
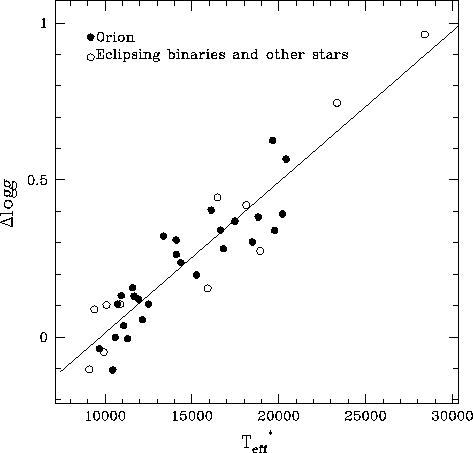
Figure 3: Difference between interpolated and fundamental log g values
vs. the photometric ![]() for the hot stars. The regression line is
the adopted correction
for the hot stars. The regression line is
the adopted correction
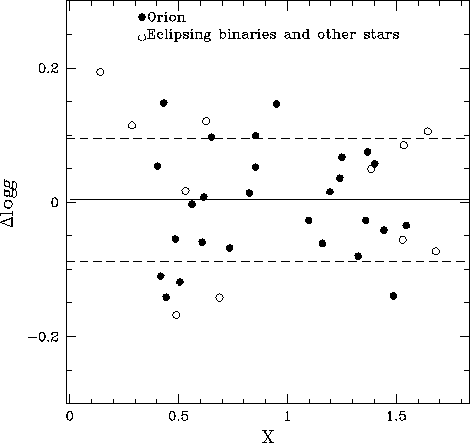
Figure 4: Difference between photometric and fundamental log g values
vs. the X parameter. The continuous line is the mean while the
broken lines define the average rms scatter
One clearly sees in Fig. 2 (click here)b that for ![]() , the scatter
increases strongly towards small values of the
X parameter, i.e. towards high temperatures, where the sensitivity of the
photometry to temperature is known to strongly decrease. On average, the rms
scatter of the difference amounts to 751 K. For X > 0.4 (
, the scatter
increases strongly towards small values of the
X parameter, i.e. towards high temperatures, where the sensitivity of the
photometry to temperature is known to strongly decrease. On average, the rms
scatter of the difference amounts to 751 K. For X > 0.4 (![]() ), the scatter reduces to 386 K, while it increases to 1388 K
for X < 0.4. This scatter is mostly attributable to errors in the fundamental data. Their contributions amount to about 96%
of the total scatter. Photometric errors induce only a small dispersion.
There is a small systematic zero-point shift of
), the scatter reduces to 386 K, while it increases to 1388 K
for X < 0.4. This scatter is mostly attributable to errors in the fundamental data. Their contributions amount to about 96%
of the total scatter. Photometric errors induce only a small dispersion.
There is a small systematic zero-point shift of ![]() , essentially due
to the hot stars, which were weighted differently by using
, essentially due
to the hot stars, which were weighted differently by using ![]() instead of
instead of ![]() to define the correction. A shift of about
to define the correction. A shift of about ![]() was present with the previous calibration of NN90.
was present with the previous calibration of NN90.
The difference between the interpolated and fundamental log g values follows
the trend shown in Fig. 3 (click here), and the interpolated
values have to be corrected according to the equation
![]()
where ![]() is the interpolated surface gravity while
is the interpolated surface gravity while ![]() is the interpolated and corrected
is the interpolated and corrected ![]() .
The fundamental values are listed in Tables 2 (click here) and 3 (click here), as well as the interpolated
and corrected ones with their standard deviations. Table 2 (click here) lists the
eclipsing binaries, for which the most fundamental values of log g can be
determined, and the non-eclipsing but well-known stars Sirius and Vega.
In Table 3 (click here) we list the members of the Orion OB1 association,
whose surface gravity is inferred
from the models of internal structure of Schaller et al. (1992) for
isochrones with log t = 6.8 (subgroup c) and 5.7 (subgroup d). Compared with
the values given by NN90, the fundamental log g values given here are about 0.06
dex smaller. This is due to the new opacities used by Schaller et al.
(1992). Figure 4 (click here) compares the photometric and fundamental values of
log g; we see that a very good accuracy can be achieved, of the order of 0.10
dex, provided the star is not too hot. On the whole range of B stars, the rms
scatter of the residuals is only
.
The fundamental values are listed in Tables 2 (click here) and 3 (click here), as well as the interpolated
and corrected ones with their standard deviations. Table 2 (click here) lists the
eclipsing binaries, for which the most fundamental values of log g can be
determined, and the non-eclipsing but well-known stars Sirius and Vega.
In Table 3 (click here) we list the members of the Orion OB1 association,
whose surface gravity is inferred
from the models of internal structure of Schaller et al. (1992) for
isochrones with log t = 6.8 (subgroup c) and 5.7 (subgroup d). Compared with
the values given by NN90, the fundamental log g values given here are about 0.06
dex smaller. This is due to the new opacities used by Schaller et al.
(1992). Figure 4 (click here) compares the photometric and fundamental values of
log g; we see that a very good accuracy can be achieved, of the order of 0.10
dex, provided the star is not too hot. On the whole range of B stars, the rms
scatter of the residuals is only ![]() dex and it is chiefly due to
errors in photometric data.
dex and it is chiefly due to
errors in photometric data.
Finally, the inverted and corrected grid for solar metallicity is shown in
Fig. 5 (click here), in the form
of a diagram log g vs. ![]() containing the lines of constant X
and constant Y parameters. Although such a diagram is unusual, it allows
graphical interpolation with the same efficiency as the usual photometric
diagrams where lines of constant physical parameters are shown.
containing the lines of constant X
and constant Y parameters. Although such a diagram is unusual, it allows
graphical interpolation with the same efficiency as the usual photometric
diagrams where lines of constant physical parameters are shown.
The reliability of the inverted grids and of the bicubic spline interpolation
used to determine the physical parameters has been tested in the following
way. Knowing the synthetic colours of each atmosphere model, we determined
the corresponding physical parameters ![]() and log g by
interpolation in the inverted, but uncorrected grid. Then, we could
verify that the interpolated
and log g by
interpolation in the inverted, but uncorrected grid. Then, we could
verify that the interpolated ![]() and log g values correspond to
those defining the model to within 1 K for
and log g values correspond to
those defining the model to within 1 K for ![]() and 0.01 dex for
log g. This holds true not only for this particular grid, but also for all
other grids presented below; the metallicity [M/H], for cool stars, is also
interpolated with an accuracy better than 0.01 dex.
and 0.01 dex for
log g. This holds true not only for this particular grid, but also for all
other grids presented below; the metallicity [M/H], for cool stars, is also
interpolated with an accuracy better than 0.01 dex.