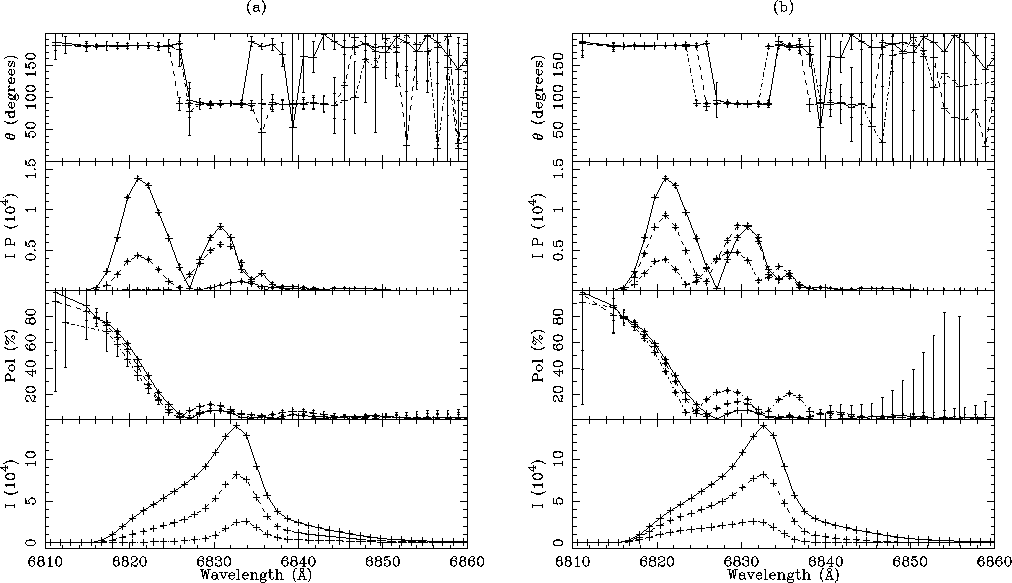
Figure 18: Raman-line models for different absorption opacities
(cf. Sect. 10 (click here)). Model
a) shows that reference model with ![]() (solid line),
(solid line),
![]() (dashed line) and
(dashed line) and ![]() (dot-dashed
line). Model b) shows the reference model with
(dot-dashed
line). Model b) shows the reference model with ![]() (solid line),
(solid line), ![]() (dashed line) and
(dashed line) and ![]() (dot-dashed line)
(dot-dashed line)
In our models the UV (![]() ) and red (
) and red (![]() )
opacities are quantified in term of the 1032 Å scattering
cross-section. These opacities will have a strong effect on the Raman
line-formation process. Schmid's (1992) models, and those computed in
this study for pure photospheric scattering
(Table 1 (click here)), show identical sensitivity to these
parameters. As expected, an increase in either opacity results in a
decrease in the Raman-line strength. However, the opacities have a
significant effect on the model line polarizations as well.
)
opacities are quantified in term of the 1032 Å scattering
cross-section. These opacities will have a strong effect on the Raman
line-formation process. Schmid's (1992) models, and those computed in
this study for pure photospheric scattering
(Table 1 (click here)), show identical sensitivity to these
parameters. As expected, an increase in either opacity results in a
decrease in the Raman-line strength. However, the opacities have a
significant effect on the model line polarizations as well.
Increasing the UV opacity effects only the parent photons. The mean free path of the photons is reduced, and photons may be absorbed before being converted to Raman photons. This results in a bias towards scattered photons originating closer to the parent-photon source than otherwise occurs.
Increasing the red opacity also reduces the observed flux of Raman photons, and although the scattering that causes the polarization of the Raman-line photons occurs in the UV, the red opacity still has an effect on the polarization. Increasing the red opacity in the photospheric-scattering models leads to a mild increase in the line polarization because the observed geometrical distribution of the Raman intensity changes.
To quantify these arguments, the reference model was modified by using
![]() , 1, and 5, and
, 1, and 5, and ![]() , 1, and 5
(Fig. 18 (click here)). As expected, an increase in the opacities results
in a decrease in the line intensity.
The blue side of the profile decreases
most rapidly with increasing
, 1, and 5
(Fig. 18 (click here)). As expected, an increase in the opacities results
in a decrease in the line intensity.
The blue side of the profile decreases
most rapidly with increasing ![]() ,
resulting in a symmetrical, redshifted intensity profile
for the
,
resulting in a symmetrical, redshifted intensity profile
for the ![]() model. There are also dramatic changes in
the polarized-flux profile as the red opacity increases. The bluemost
polarized-flux peak observed in the
model. There are also dramatic changes in
the polarized-flux profile as the red opacity increases. The bluemost
polarized-flux peak observed in the ![]() model is much
reduced in the
model is much
reduced in the ![]() model, and is not produced in the
model, and is not produced in the
![]() profile. The central maximum in the polarization
profile increases with increasing
profile. The central maximum in the polarization
profile increases with increasing ![]() , in agreement
with the pure photospheric-scattering models.
, in agreement
with the pure photospheric-scattering models.
The intensity profiles of the ![]() models retain their
general shape
with increasing UV opacity, although their intensities decrease. The
polarization profiles show a monotonic increase in the central
maximum, with the maxima increasing blueshifted. The
models retain their
general shape
with increasing UV opacity, although their intensities decrease. The
polarization profiles show a monotonic increase in the central
maximum, with the maxima increasing blueshifted. The ![]() model shows a redshifted polarization peak that is not present in the
other models. As expected, the polarized flux decreases with
increasing UV opacity. The wavelength of the position-angle flip is
also blueshifted with increasing
model shows a redshifted polarization peak that is not present in the
other models. As expected, the polarized flux decreases with
increasing UV opacity. The wavelength of the position-angle flip is
also blueshifted with increasing ![]() .
.
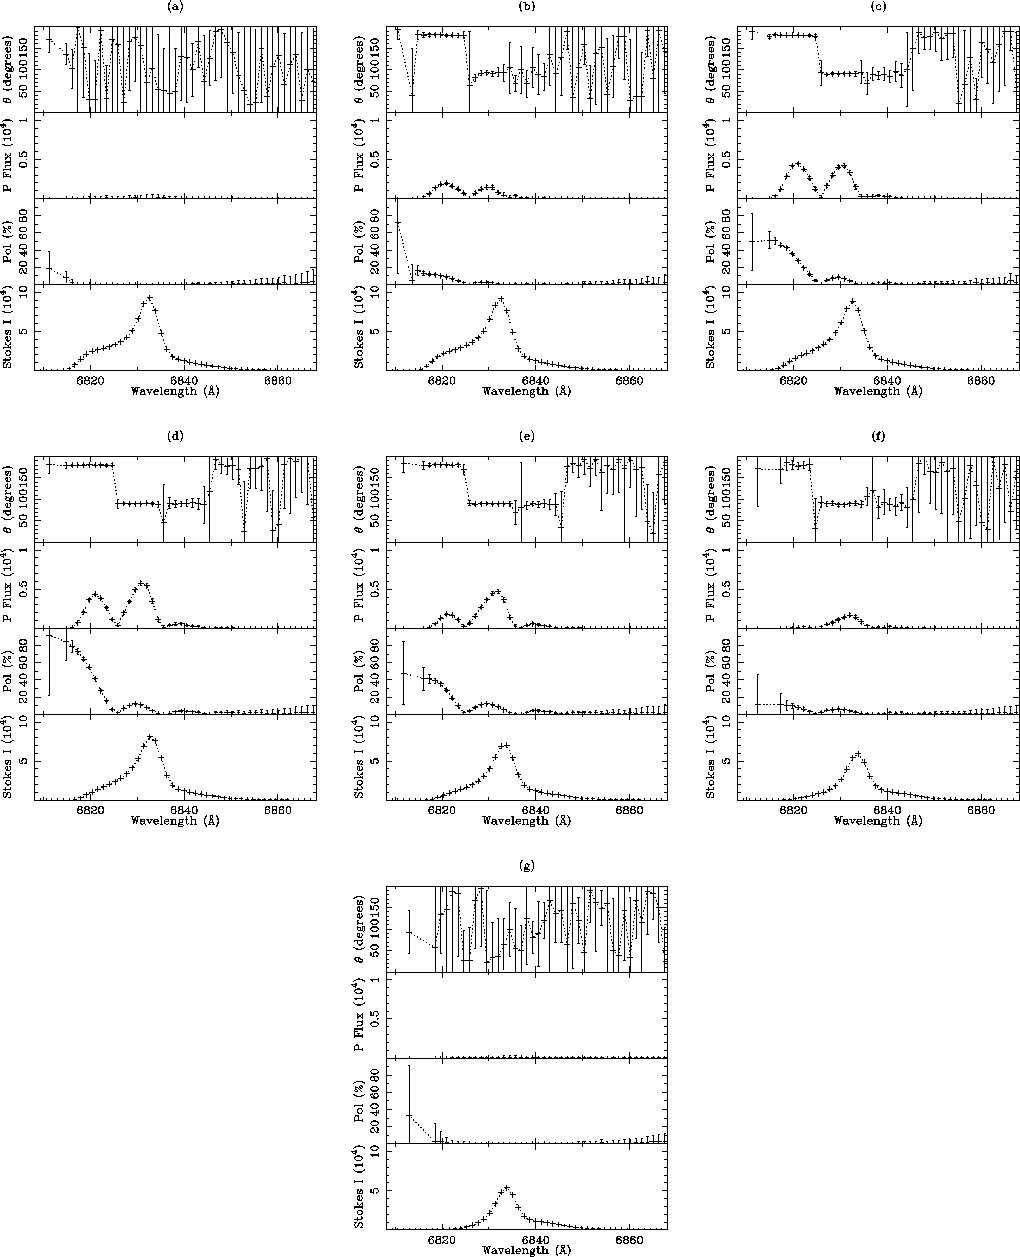
Figure 19: Raman-line polarization spectra for models with
![]() (Sect. 10 (click here)) at viewing
angles of
(Sect. 10 (click here)) at viewing
angles of ![]() -
-![]() at steps of 30
at steps of 30![]() a-g).
Other parameters are those of the reference model
a-g).
Other parameters are those of the reference model
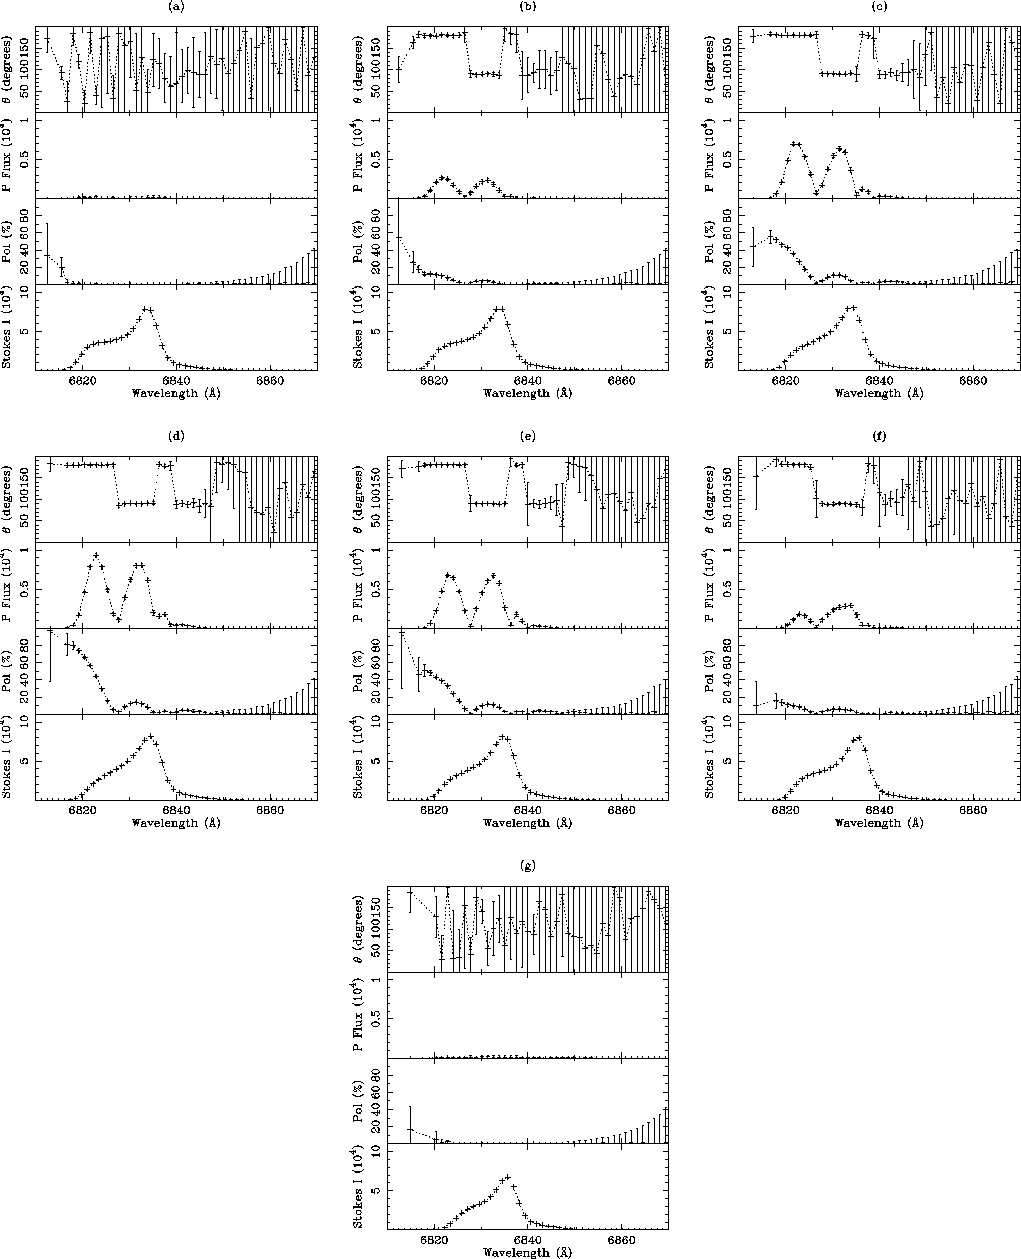
Figure 20: Raman-line polarization spectra for models with
![]() (Sect. 10 (click here)) at viewing
angles of
(Sect. 10 (click here)) at viewing
angles of ![]() -
-![]() at steps of 30
at steps of 30![]() a-g).
Other parameters are those of the reference model
a-g).
Other parameters are those of the reference model
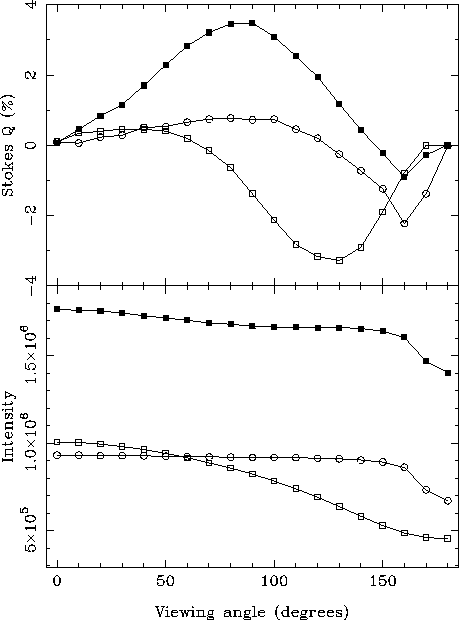
Figure 21: The integrated line intensity (lower panel) and polarization (upper
panel) as a function of phase for models
with ![]() (open squares) and with
(open squares) and with
![]() (open circles). The reference-model results are
shown for comparison (filled squares)
(open circles). The reference-model results are
shown for comparison (filled squares)
Further models were computed in order to investigate the phase
dependence of the polarization spectra for ![]() and
for
and
for ![]() (Figs. 19 (click here)
and 20 (click here)). The integrated line intensities of the
models are shown as a function of viewing angle in
Fig. 21 (click here).
(Figs. 19 (click here)
and 20 (click here)). The integrated line intensities of the
models are shown as a function of viewing angle in
Fig. 21 (click here).
The line profiles of the ![]() models
(Fig. 19 (click here)) show a significantly different
viewing-angle dependence to the reference model. The main differences
occur in the blue wing of the profile, which is much less intense at
all phases, but particularly when
models
(Fig. 19 (click here)) show a significantly different
viewing-angle dependence to the reference model. The main differences
occur in the blue wing of the profile, which is much less intense at
all phases, but particularly when ![]() . This is because
the blue wing of the line is the result of Raman scattering in the
volume of the wind that is approaching the parent photon source. This
is also the region with the highest density, and Raman photons that
are created in this region have the largest absorption optical depth
to the observer. This effect is most clearly seen in the
. This is because
the blue wing of the line is the result of Raman scattering in the
volume of the wind that is approaching the parent photon source. This
is also the region with the highest density, and Raman photons that
are created in this region have the largest absorption optical depth
to the observer. This effect is most clearly seen in the
![]() model (Fig. 19 (click here)g), in which the
intensity profile is symmetric and redshifted (since no blue-shifted
Raman photons are observed, because of both occultation and absorption
in the wind). The integrated line intensity of the
model (Fig. 19 (click here)g), in which the
intensity profile is symmetric and redshifted (since no blue-shifted
Raman photons are observed, because of both occultation and absorption
in the wind). The integrated line intensity of the ![]() shows a gradual monotonic decline as
shows a gradual monotonic decline as ![]() increases and
the absorptive opacity of the sightline to the main scattering region
increases (see Fig. 21 (click here)). The integrated polarization shows
a peak (in magnitude) at about
increases and
the absorptive opacity of the sightline to the main scattering region
increases (see Fig. 21 (click here)). The integrated polarization shows
a peak (in magnitude) at about ![]() when the
blue-shifted polarization peak (which cancels the above/below source
scatterings) disappears. Note that Q is negative as the scatterings
above and below the source dominate.
when the
blue-shifted polarization peak (which cancels the above/below source
scatterings) disappears. Note that Q is negative as the scatterings
above and below the source dominate.
The ![]() models also show differences when compared
with the reference model. The phase dependence of the intensity
profile is the same as that of the reference model
(Fig. 21 (click here)), but the polarized-flux profiles are quite
different. The blue-shifted polarized-flux peak is approximately the
same intensity and the red-shifted peak, over all viewing angles. This
is in contrast to the reference model, in which the blue
polarized-flux peak is the more intense for all viewing angles
models also show differences when compared
with the reference model. The phase dependence of the intensity
profile is the same as that of the reference model
(Fig. 21 (click here)), but the polarized-flux profiles are quite
different. The blue-shifted polarized-flux peak is approximately the
same intensity and the red-shifted peak, over all viewing angles. This
is in contrast to the reference model, in which the blue
polarized-flux peak is the more intense for all viewing angles
![]() . The integrated line polarization light-curve is
similar to that of the reference model, although the magnitude of the
polarization is lower, as the scatterings are occuring closer to the
soure, thus reducing the asymmetry of the scattering geometry.
. The integrated line polarization light-curve is
similar to that of the reference model, although the magnitude of the
polarization is lower, as the scatterings are occuring closer to the
soure, thus reducing the asymmetry of the scattering geometry.
The absorption opacities are important parameters, affecting the
strength, intensity profile, and polarization spectra of the
Raman-scattered lines. Increasing ![]() results in a
reduction in the emergent flux from the regions of the wind that have
greatest absorption depth to the observer. This generally means that
the blue
wing of the profile, which results from scattering in the part of the
wind that is approaching the photon source, is reduced. The red opacity
has less effect on flux that has been Raman scattered in the more
tenuous parts of the wind, where the optical depth to the observer is
much lower. The UV opacity has a more dramatic effect on the
polarization spectra of the Raman lines, in agreement with the
pure-photospheric scattering models given by Schmid (1992).
results in a
reduction in the emergent flux from the regions of the wind that have
greatest absorption depth to the observer. This generally means that
the blue
wing of the profile, which results from scattering in the part of the
wind that is approaching the photon source, is reduced. The red opacity
has less effect on flux that has been Raman scattered in the more
tenuous parts of the wind, where the optical depth to the observer is
much lower. The UV opacity has a more dramatic effect on the
polarization spectra of the Raman lines, in agreement with the
pure-photospheric scattering models given by Schmid (1992).