

Up: Blind source separation and
Many experiments were carried out with these algorithms. For each
one we got mixing and demixing matrices and image sources. Even
though a visual appreciation of the resulting sources was
informative, a quantitative quality measurement was needed.
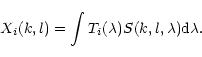
The spectrum at pixel location (k,l) is called
 ,
,
 being the wavelength. Each image Xi(k,l) is observed
with a filter of transmission profile
being the wavelength. Each image Xi(k,l) is observed
with a filter of transmission profile
 .
We have:
.
We have:
 |
(11) |
Let us call c(i,j) the demixing coefficient of source j for
image i, source Sj(k,l) is written as:
 |
(12) |
Eqs. (11) and (12):
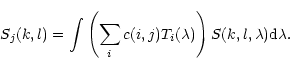 |
(13) |
We can write:
 |
(14) |
with:
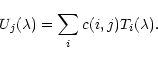 |
(15) |
The sources can be considered as the observed images through
filters
 ,
which are called the source filters. For
each BSS we display the set of its source filters.
,
which are called the source filters. For
each BSS we display the set of its source filters.
From each BSS, the image energy coming from a given source was
evaluated. Then we can compute the energy related to each source
from all the images. This criterion allows us to classify the
sources by decreasing energy.
The source images are displayed in order to optimize the contrast.
That allows us to compare the different sources in the best
contrast conditions. This visual comparison was essential to
select the best identification, but it is too qualitative.
Up: Blind source separation and
Copyright The European Southern Observatory (ESO)