Let's call w0 the total energy that hits the AIC beamsplitter (i.e., the
total energy collected on the star by the telescope taking into account optical
transmission before the AIC).
This quantity is twice the total energy from the twin images.
From the derivation in Paper I, the normalised integrated residual energy is given
by:
![]()
where D is the diameter of the telescope, r0 is the Fried parameter in the visible and pJ is a coefficient depending on J, the index of the last Zernike polynomial corrected.
In Fig. 4 we plot the value of the integrated residual intensity gJversus the factor
![]() for a sample of data collected
during
the observation run.
The filled circles stand for gJ measured when adding the whole set of images of
a
star and the squares stand for gJ measured when adding only selected best images
of a star.
The selected best images for each target represent between 8% and 15% of the
total
number of images (in Sect. 4.2 we have explained why the number of
images
varies from quality-class to another). The best regression lines (whole set and
selected set) are also drawn. They yield respective estimates of pJ via the
expression:
for a sample of data collected
during
the observation run.
The filled circles stand for gJ measured when adding the whole set of images of
a
star and the squares stand for gJ measured when adding only selected best images
of a star.
The selected best images for each target represent between 8% and 15% of the
total
number of images (in Sect. 4.2 we have explained why the number of
images
varies from quality-class to another). The best regression lines (whole set and
selected set) are also drawn. They yield respective estimates of pJ via the
expression:
![]() .
For
the whole set of images we find pJ=0.009 (solid line in Fig. 4) while
for the selected images
pJ=0.0065 (dashed line in Fig. 4).
The theoretical coefficient pJ for BOA is 0.0025. In comparison the AO acts as
if
it was an AO completely efficient up to radial mode N=7 (36 polynomials).
The error bars show the 1
.
For
the whole set of images we find pJ=0.009 (solid line in Fig. 4) while
for the selected images
pJ=0.0065 (dashed line in Fig. 4).
The theoretical coefficient pJ for BOA is 0.0025. In comparison the AO acts as
if
it was an AO completely efficient up to radial mode N=7 (36 polynomials).
The error bars show the 1![]() dispersion. Vertically the precision
has
been estimated taking into account the temporal variation of the extinction and of
the total energy collected w0. Horizontally the limitations come mainly
from the temporal variation of the r0 during the observations. This variation of
r0 is estimated from the BOA measurements taken on each star.
dispersion. Vertically the precision
has
been estimated taking into account the temporal variation of the extinction and of
the total energy collected w0. Horizontally the limitations come mainly
from the temporal variation of the r0 during the observations. This variation of
r0 is estimated from the BOA measurements taken on each star.
We have to take into account the shape of the halo because it makes the detection
capability variable with the location of the image of a companion. In addition we
want to visualize the shape of the halo of residual light effectively obtained from
the observational data. For that matter we consider the case where AIC has given
its
best results (here
![]() ).
In Fig. 5 we show profiles of the normalised flux pertaining
respectively to the diffraction pattern of the telescope, central obscuration taken
into account (profile a), to the observed image without coronagraph and where
AO provides a Strehl Ratio of 90% in K band (profile b, 150 images), to the
residual light averaged over the whole set of images (profile c, 1200
images) and to the residual light averaged over the set of selected best
images (profile d, 150 out of 1200 images).
In Paper I, we suggested that the residual energy is
spread over an extended halo, what is effectively found from our data.
Unsurprisingly the coronagraphed profile from the selected set is lower and
less extended than the profile from the whole set. This change brings in a
reduction of the integrated energy from 7.5% to 5.5% that is a lowering
factor of 0.73 and reduces the height of the central peak from 2.6%
to 2.1%
that is a lowering factor of 0.8. Those numerical figures illustrates the
interest of a selection process and the presented profiles show where and
how the situation is thus improved.
).
In Fig. 5 we show profiles of the normalised flux pertaining
respectively to the diffraction pattern of the telescope, central obscuration taken
into account (profile a), to the observed image without coronagraph and where
AO provides a Strehl Ratio of 90% in K band (profile b, 150 images), to the
residual light averaged over the whole set of images (profile c, 1200
images) and to the residual light averaged over the set of selected best
images (profile d, 150 out of 1200 images).
In Paper I, we suggested that the residual energy is
spread over an extended halo, what is effectively found from our data.
Unsurprisingly the coronagraphed profile from the selected set is lower and
less extended than the profile from the whole set. This change brings in a
reduction of the integrated energy from 7.5% to 5.5% that is a lowering
factor of 0.73 and reduces the height of the central peak from 2.6%
to 2.1%
that is a lowering factor of 0.8. Those numerical figures illustrates the
interest of a selection process and the presented profiles show where and
how the situation is thus improved.
However, we should have observed a depression at the origin in the coronagraphed profiles, as expected from the analysis in Paper I. and this is clearly not confirmed by our profiles from data. This discrepancy between expected and observed profiles is well explained on the theoretical ground by unstabilities affecting OPD (see Paper I) and this situation has been clearly met in our observations, as commented in Sect. 3.2 (specific conditions of observation). In addition, the central hole expected from the theoretical extinction profile can yield full extinction only over an area smaller than the pixel size. Therefore a small fraction of the residual energy is constantly present and prevents the "full darkening" of the central pixel. This also contributes to the observed central peak (but significantly less than OPD variations do).
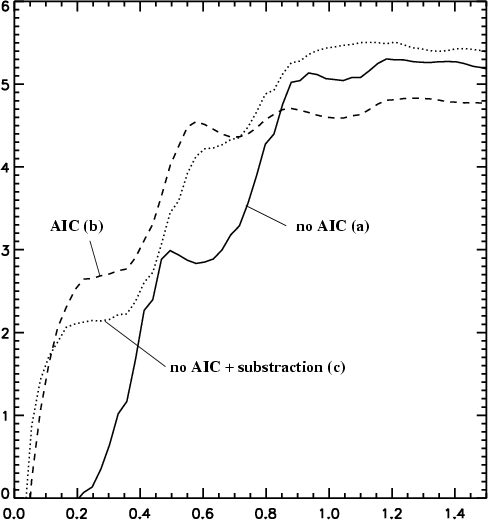
In Fig. 6 we show the ![]() accessible from raw data without
and
with AIC (curve a curve b) for typical conditions of turbulence
(
accessible from raw data without
and
with AIC (curve a curve b) for typical conditions of turbulence
(
![]() ).
Substracting the comparison star from the target star profile (both obtained
without
AIC) yields the curve c. It is apparent from the graph that curve b and c
correspond
to nearly the same detection sensitivity, what means that working with raw data of
AIC is as good as working with "cleaned'' data without AIC. Such a situation shows
that processing raw data is necessary to improve the detectivity and ultimately to
recover the expected performance.
).
Substracting the comparison star from the target star profile (both obtained
without
AIC) yields the curve c. It is apparent from the graph that curve b and c
correspond
to nearly the same detection sensitivity, what means that working with raw data of
AIC is as good as working with "cleaned'' data without AIC. Such a situation shows
that processing raw data is necessary to improve the detectivity and ultimately to
recover the expected performance.
Substracting
the mean radial profile is possible as soon as the correction by AO is
good enough (Strehl Ratio (SR) larger than 50%)
what is the case here. In
Fig. 7 the ![]() is calculated as described in
Sect. 5.2.
In this figure we show for comparison the
is calculated as described in
Sect. 5.2.
In this figure we show for comparison the ![]() detectable from raw data (curve
a
in Fig. 7). The curves
b and c (Fig. 7) shows the
detectable from raw data (curve
a
in Fig. 7). The curves
b and c (Fig. 7) shows the
![]() accessible respectively for the radial process and for the comparison
process (both curves uses the whole set of images available for the target star and
the comparison star).
accessible respectively for the radial process and for the comparison
process (both curves uses the whole set of images available for the target star and
the comparison star).
 |
Figure 7: Vertically: magnitude difference accessible. Horizontally: separation with the main star in arcseconds. See text for details |
For this configuration (star magnitude, number of frames, exposure time and high
noise of the camera), the detectability is limited to
![]() beyond 1 arcsec
separation.
We can note that close to the star the radial process is more efficient than the
comparison process. In fact, close to the star the shape of the profile is very
similar to the theoretical radial profile (large SR). This leads to a shape of
diffraction pattern very similar to the theoretical one. Since this pattern is
radial
the radial process works well. Besides, the comparison process is not very
efficient
close to the star because of the possible incidental on-axis pointing shift between
the target star and comparison star. This slight angular shift makes the respective
mean patterns unequal close to the axis, and limits the efficiency of the
comparison
process.
beyond 1 arcsec
separation.
We can note that close to the star the radial process is more efficient than the
comparison process. In fact, close to the star the shape of the profile is very
similar to the theoretical radial profile (large SR). This leads to a shape of
diffraction pattern very similar to the theoretical one. Since this pattern is
radial
the radial process works well. Besides, the comparison process is not very
efficient
close to the star because of the possible incidental on-axis pointing shift between
the target star and comparison star. This slight angular shift makes the respective
mean patterns unequal close to the axis, and limits the efficiency of the
comparison
process.
In the comparison process used far from the star the detectivity is reduced because
noises from target and comparison contribution are added, then decreasing the
detectable ![]() .
.
As described in Paper I one specific interest of AIC is its capabilities of
detection close to the star. Then to study the efficiency of the AIC close to the
star, we calculate the ![]() accessible with a selection of the best images of
both target and comparison star for the two reduction processes we are interested
in
(curve d for radial process and curve e for comparison process, both in
Fig. 7). When using the selection of best images we keep about 150
images while with the whole set of data we use 900 images.
accessible with a selection of the best images of
both target and comparison star for the two reduction processes we are interested
in
(curve d for radial process and curve e for comparison process, both in
Fig. 7). When using the selection of best images we keep about 150
images while with the whole set of data we use 900 images.
Using a reduced number of images tends to decrease the detectable ![]() far
from
the star. Conversely, close to the star this
far
from
the star. Conversely, close to the star this ![]() is increased because the
selection tends to favor images with the highest wavefront quality which results in
removing residual energy around the axis first.
is increased because the
selection tends to favor images with the highest wavefront quality which results in
removing residual energy around the axis first.
We have shown in this section that the selection of images helps increasing detectability of faint structures close to the axis. The use of reference stars does not seem necessary from the averaged radial curves we show. However, when searching for faint structures, one can be misled by fixed speckles mainly coming from aberrations in the wavefront sensor unit or in the optical set-up standing between the AO output beamsplitter and the AIC entrance. Reference sources are then still necessary.
Though, for this star, the magnitude difference to deal with is not very
challenging
it shows how AIC works. A more challenging star is HD 211073 for which we
have to face magnitude differences
![]() (Hipparcos
Catalogue ESA 1997),
(Hipparcos
Catalogue ESA 1997),
![]() and
and
![]() (Ten Brummelaar et al. 1996) and a
separation of 0.4'' (Hartkopf et al. 1996). For this star the best
results
have been obtained with the radial process, because the superimposition of target
star and comparison star was not good enough. No faint companion appears clearly
but
at the position given by Hipparcos Catalogue (ESA 1997) and
Hartkopf et al.
(1996) two symmetrical bright speckles appear at the level of the
residual
fixed speckle noise. The difference of magnitude derived from the level of these
speckles is
(Ten Brummelaar et al. 1996) and a
separation of 0.4'' (Hartkopf et al. 1996). For this star the best
results
have been obtained with the radial process, because the superimposition of target
star and comparison star was not good enough. No faint companion appears clearly
but
at the position given by Hipparcos Catalogue (ESA 1997) and
Hartkopf et al.
(1996) two symmetrical bright speckles appear at the level of the
residual
fixed speckle noise. The difference of magnitude derived from the level of these
speckles is
![]() .
This result is not in agreement with a low mass
companion
hypothesis derived by Ten Brummelaar et al. (1996).
.
This result is not in agreement with a low mass
companion
hypothesis derived by Ten Brummelaar et al. (1996).
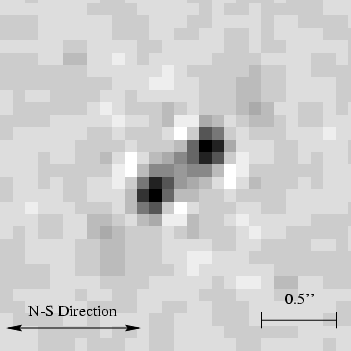 |
Figure 9: Image of the faint component of the double star HD 213310. Separation of the two components is the third of the diffraction limit. Difference of magnitude in K is estimated at about 3.5 |
To show that the AIC can detect companions as close to the star as half of the
distance of the first Airy ring we observed the star HD 213310 (5
Lac). The two components of the star are only about 0.11 arcsec appart (one
third of the first dark Airy ring). This companion is too close to the star to be
resolved by the telescope, but as shown in Paper I, it should be possible to detect
this companion with AIC. Figure 9 shows that this possibility is effective
and that a sensing of the environment as close as a third of the Airy angular
radius
has been achieved with AIC. Let us give few comments regarding this point.
The image of a companion closer than the first Airy ring appears as two spots
symmetrically located at 0.6 times the distance of the first dark Airy ring (Paper
I), i.e. 0.22 arcsec here, even if the true separation is different. Actually
the
true separation governs the apparent flux, not the location of the image. The
bright
spots (twin images) from HD 213310 effectively appear at the expected
location, with a Signal to Noise (SNR) of 5 (Fig. 9). Both the radial and
comparison processes give the same result. The intensity ratio between the main
star
and these spots is 42. From this estimate and taking an average separation of
0.11 arcsec (Hartkopf et al. 1996) a magnitude difference
![]() is found. The uncertainty
is found. The uncertainty ![]() comes from the
uncertainty
regarding the angular separation and also from the low level of detection (SNR = 5).
This magnitude difference is consistent with the spectral types of the 2 stars.
Markowitz (1969) gives for these stars M0II+B8V (see also
Ginestet et al. 1997 for more references on this star).
comes from the
uncertainty
regarding the angular separation and also from the low level of detection (SNR = 5).
This magnitude difference is consistent with the spectral types of the 2 stars.
Markowitz (1969) gives for these stars M0II+B8V (see also
Ginestet et al. 1997 for more references on this star).
Classical Lyot coronagraph can not image a companion so close to the main star. Actually, the masks used in Lyot-type coronagraphs cover 2 to 10 times the distance of the first Airy ring (Malbet 1996) and most of the time they cover 4 or 5 times this distance (Beuzit et al. 1997; Mouillet et al. 1997). As we have shown in this section, AIC can image the faint companion at one third of this distance (first dark Airy ring).
Copyright The European Southern Observatory (ESO)