 |
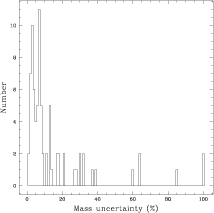
Figure 1: Distribution of the uncertainty (in per cent) of the individual masses after this study |
Among the 80 stars, 64 have a mass whose uncertainty is lower than 20 per cent (e.g., HIP 7580 A and B). This is the large majority, but let us recall that 20 per cent of uncertainty is still large for subsequent investigations (e.g., calibration of a mass-luminosity relation). We know the mass of 52 stars (65 per cent of the sample) at a level of uncertainty lower than ten per cent (e.g., HIP 14328 A and B). And, finally, at an uncertainty level lower than or equal to five per cent, we still have 25 stars (e.g., HIP 8903 A and B). With modern interferometers (CHARA-ARRAY, NPOI, TPI, ...), this number should promptly grow.
To generate the histogram in Fig. 1, we used a maximum threshold of one hundred
per cent (threshold reached by HIP 98416 A and B). The uncertainty is actually much larger
than the plotted value. Indeed, nothing reliable could be derived for that system due to the
very large correlation between i and ![]() .
.
We should also stress on the fact that the above uncertainties are consistent with the actual
uncertainties of the observations. Indeed, we check the consistency of the guessed standard
deviations on the observations with those of the (O-C) after the minimization
(Pourbaix 1998). In case of discrepancies, the input values were revised and the
minimization was repeated. We can thus guarantee that the uncertainties we derive for the
masses are realistic. Even if we limit the sample to the main-sequence stars, we seldom
reach the 2%-accuracy required (Andersen 1991; Andersen 1997) for constraining
theoretical models. However, the mass of some non main-sequence stars is precise (hopefully
accurate) enough (e.g. ![]() Per) to point out some underlying problems
(Pourbaix 1999).
Per) to point out some underlying problems
(Pourbaix 1999).
The evolution of the uncertainty of the masses is more difficult to analyze. Indeed, an
uncertainty of ten per cent on a wrong result is worse than fifteen per cent on a good one
(e.g., HIP 677 B). We thus restrict the comparison on stars for which the mass we obtain
lies in a
![]() -interval centered on the published value of the mass (we use the
published
-interval centered on the published value of the mass (we use the
published
![]() ). This restriction leads to a drastic reduction of the number of stars:
we have 42 stars left (instead of 80).
). This restriction leads to a drastic reduction of the number of stars:
we have 42 stars left (instead of 80).
The plot in Fig. 2 gives the evolution of the uncertainty on the
42 masses. The former uncertainties are those computed from the pairs (M,
![]() )
given in
the papers listed in Table 1. We reduced the uncertainty for 23 stars. The
worst evolution concerns HIP 104987 for which our uncertainties are 33 and 32 per cent
whereas Armstrong et al. (1992) announced 14 and 11 per cent. However, in some cases, it
may be judicious to re-assess the quoted errors because large variations may be caused by
previous overestimation of the obtained precision.
)
given in
the papers listed in Table 1. We reduced the uncertainty for 23 stars. The
worst evolution concerns HIP 104987 for which our uncertainties are 33 and 32 per cent
whereas Armstrong et al. (1992) announced 14 and 11 per cent. However, in some cases, it
may be judicious to re-assess the quoted errors because large variations may be caused by
previous overestimation of the obtained precision.
The best improvement concerns both components of HIP 108917 for which we decreased the
uncertainty from 60 down to thirteen and fourteen per cent. However, since there is a
correlation between a, i and ![]() ,
the actual improvement might be not that
important. We also recall that the orbital parallax for that system is not consistent with
the Hipparcos result.
,
the actual improvement might be not that
important. We also recall that the orbital parallax for that system is not consistent with
the Hipparcos result.
Copyright The European Southern Observatory (ESO)