

Up: Orbital structure and mass
Subsections
2 Spectroscopic observations
The spectroscopic data were collected during six runs of observations,
between 1992 and 1996, using the ESO NTT in La Silla (the first run in
visitor mode and the other three in remote observing mode from
Garching) and the 3.5 m telescope in Calar Alto. Table 1
summarizes the instruments and detectors used and their setups. Table
2 gives the log of the observations. To maximize the signal
at large radii, large slit widths were used. These rather than seeing
set the spatial resolution of the observations in all cases except run
#1.
Table 2:
Log of the spectroscopic observations. Column 1 gives the galaxy
name, Col. 2 the run number (see Table 1), Col. 3 the
slit position angle in degrees, Col. 4 the position across the galaxy
(see notes), Col. 5 the shift from the center (see text), Col. 6 the
exposure time, Col. 7 the number of collected frames
| Galaxy |
Run |
PA |
Position1 |
Shift |
Exp.Time |
Number |
| |
|
[ ] ] |
|
[''] |
[hours] |
of Frames |
| NGC 315 |
2 |
44 |
MJ |
- |
0.71 |
1 |
| |
5 |
135 |
pMN |
58 |
6.72 |
5 |
| NGC 3379 |
6 |
80 |
MJ |
- |
1.5 |
1 |
| |
6 |
170 |
pMN |
35 |
12 |
8 |
| NGC 4374 |
6 |
126 |
MJ |
- |
1.5 |
1 |
| |
6 |
36 |
pMN |
17 |
1.8 |
2 |
| |
6 |
36 |
pMN |
55 |
3.3 |
2 |
| NGC 5846 |
2 |
70 |
MJ |
- |
2.5 |
2 |
| |
2 |
160 |
pMN |
80 |
7.5 |
5 |
| NGC 7145 |
2 |
160 |
MJ |
- |
1.5 |
1 |
| |
2 |
270 |
pMN |
38 |
14.3 |
12 |
| NGC 7192 |
4 |
10 |
MJ |
- |
1.5 |
1 |
| NGC 7507 |
1 |
72 |
D |
- |
1.75 |
2 |
| |
12 |
18 |
pMN |
48 |
5 |
5 |
| NGC 7626 |
3 |
15 |
MJ |
- |
1.5 |
1 |
| |
5 |
105 |
pMN |
57 |
9.4 |
7 |
| (1) MJ: major axis; pMN: parallel to the minor
axis; D: diagonal. |
| (2) Slit width 1.5''. |
The standard reduction steps (bias subtraction, flat fielding, cosmic
ray removal, logarithmic wavelength calibration, sky subtraction) were
performed under MIDAS. A sky subtraction better than 1 per cent was
achieved. The analysis of the data was carried out using the FCQ
method (Bender [1990]) following BSG94, G+98 and S+2000. The spectra were
rebinned along the spatial direction to obtain a nearly constant
signal-to-noise ratio larger than 50 per resolution element. The
effects of the continuum fitting and instrumental resolution were
extensively tested by Monte Carlo simulations. The residual systematic
effects on the values of the h3 and h4 profiles are less than
0.01, and less than 1.5% in  .
In general, in the inner parts
of the galaxies the errorbars (which reflect
the random errors and do not take into account systematic effects such
as template mismatching or the presence of dust and faint emission,
see below) are small, in the range 3 - 7 km s-1 for the recessional
velocities and velocity dispersion, and
0.006-0.02 for the h3 and
h4 coefficients. The errors are larger in the outer parts, where
the signal-to-noise ratio can be lower.
They are calibrated with simulations and are
determined to better than 20%. Figures 1 and 2
present the results. Figures 3-8 compare the
data to the literature. We discuss individual galaxies here below.
Note that NGC 315, NGC 7507 and NGC 7145 appear to have noisier data
than the rest, despite the long integration times (see
Table 2). NGC 315 is the most distant galaxy of the sample,
NGC 7507 has been observed with a tighter slit and NGC 7145 is the
intrinsically faintest galaxy of the sample (see Table 3).
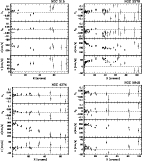 |
Figure 1:
The kinematics of NGC 315, NGC 3379, NGC 4374, NGC 5846.
From bottom to top: the folded
mean velocity, velocity dispersion, h3 and h4profiles. Stars and filled circles refer to the two sides of the
galaxy and the major axis spectrum. Crosses and open squares refer to
the two sides of the galaxy and the spectra taken parallel to the
minor axis and shifted 58 (NGC 315), 35 (NGC 3379), 55 (NGC 4374) and
80 (NGC 5846) arcsec from the center. Open and filled triangles refer to
the two sides of NGC 4374 and the spectra taken parallel to the
minor axis and shifted 17 arcsec from the center |
 |
Figure 2:
The kinematics of NGC 7145, NGC 7192, NGC 7507, NGC 7626.
From bottom to top: the folded
mean velocity, velocity dispersion, h3 and h4profiles. Stars and filled circles refer to the two sides of the
galaxy and the major axis spectrum. Crosses and open squares refer to
the two sides of the galaxy and the spectra taken parallel to the
minor axis and shifted 38 (NGC 7145), 48 (NGC 7507) and 57 (NGC 7626)
arcsec from the center |
The spectra in the inner 2 arcsec show variable H emission, which
is probably responsible for the jumps observed in the v and
  values. The two most distant datapoints have rather poor
signal-to-noise ratio. The related values of h3 and h4 are very
uncertain; only the values of
  and v are given. The
comparison with the old data of Schechter & Gunn (1979) and the
velocity profile of Davies & Birkinschaw ([1988])
(Fig. 3) is good within the
rather large errors of the literature data.
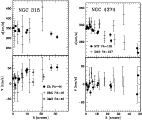 |
Figure 3:
Left: comparison with the velocity dispersion (top)
and rotation velocities (bottom) of
Schechter & Gunn ([1979], crosses) and Davies & Birkinshaw ([1988],
only velocities, open triangles) for NGC 315. Right:
comparison with the velocity dispersion (top)
and rotation velocities (bottom) of Davies & Birkinshaw ([1988],
crosses) for NGC 4374. The data of Carollo et al. ([1993])
have large error bars, within which they agree with our profiles |
The data taken along the major axis of the galaxy follow closely the
results of Statler & Smecker-Hane ([1999]) (Fig. 4).
The data along the shifted direction reach 100 arcsec from the center and
show a declining (cylindrical) velocity, with negative values at 100 arcsec
confirmed in the 8 separate frames.
The velocity dispersions and h4 values along the major axis given
in BSG94 (not shown here) appear slightly larger. The h3 values and
velocities agree well.
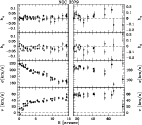 |
Figure 4:
The kinematics of NGC 3379 compared to the
results of Statler & Smecker-Hane ([1999]). From bottom to top: the folded
mean velocity, velocity dispersion, h3 and h4profiles. Stars and filled circles refer to the two sides of the
galaxy and the major axis spectrum obtained here. Open and filled
squares refer to the major axis data of Statler & Smecker-Hane
([1999]). Note the changes of scales between the left and the right rows |
The galaxy shows OIII emission in the inner 3 arcsec, where some
differences between the two sides of the galaxy in the (folded)
velocity, h3 and  appear larger than the errorbars. No
rotation is detected along the major axis; there
is a hint of a 10 km s-1 (cylindrical) rotation as measured
parallel to the minor axis (the 17 arcsec shift). Apart from the
inner 3 arcsec (where emission is seen) there is no template
mismatching. The last datapoint has low S/N and h4 might not be
reliable. The antisymmetric term h3 is approximately zero
everywhere; the h4 is small and slightly positive.
The comparison with the v and  profile of Davies and
Birkinshaw ([1988]) is satisfactory (Fig. 3). Their
 data tend to be systematically higher than ours (at most
20 km s-1 at R=10 arcsec).
This might be due to their bad spectral resolution and/or
differences in the slit aperture. Carollo et al. ([1993])
compare their data (affected by rather large errors) with Davies &
Birkinshaw ([1988]), finding agreement.
The galaxy shows a slowly declining velocity dispersion, with no
rotation and small h3 and h4 values.
Comparisons are given for the v and  profiles to the data of
Franx et al. ([1989]) and BSG94, where reasonable agreement is obtained
(Fig. 5). The same is achieved for the data of Carollo
et al. ([1993]), which have large errors and are not shown
here. Sembach & Tonry ([1996]) obtained a radially extended major
axis kinematic profile with a pioneering (hardware) method to perform
sky subtraction. The authors themselves note that their values are
6-7% higher than previous observations. Somewhat higher bias
is observed here. The h3 and h4 data given by BSG94 are
compatible with the present dataset, within their large errors.
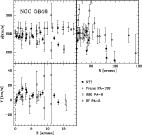 |
Figure 5:
Comparison with the velocity dispersion (top)
and rotation velocities (bottom) of Franx et al. ([1989], crosses),
BSG94 (open squares), Sembach & Tonry ([1996], open triangles).
The data of Carollo et al. ([1993]) have large
error bars, within which they agree with our profiles.
Note the change of scale at 19 arcsec |
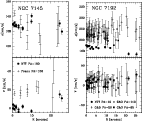 |
Figure 6:
Left: comparison with the velocity dispersion (top)
and rotation velocities (bottom) of Franx et al. ([1989], crosses) for
NGC 7145. Right: comparison with the velocity dispersion (top)
and rotation velocities (bottom) of Carollo & Danziger ([1994], major
axis: crosses, minor axis: open squares, diagonal axis: open
squares) for NGC 7192 |
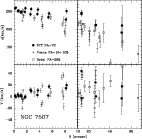 |
Figure 7:
Comparison with the velocity dispersion (top)
and rotation velocities (bottom) of Franx et al. ([1989], crosses),
Bertin et al. ([1994], open squares). Note the change of scale at 10
arcsec |
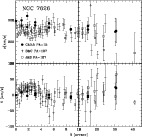 |
Figure 8:
Comparison with the velocity dispersion (top)
and rotation velocities (bottom) of Balcells & Carter ([1993], crosses),
Jedrzejewski & Schechter ([1989], open squares).
Note the change of scale at 10 arcsec |
The galaxy has a rather low velocity dispersion, at the limit of the
instrumental resolution (
 km s-1,
 km s-1).
Simulations show that there might be still some systematic
effects at the 3% level in
  and 0.01-0.02 in h4. The
velocity data parallel to the minor axis are mirrored antisymmetrically with respect to the major axis. The velocity
dispersions measured by Franx et al. ([1989]) are consistent within the
errors. Their velocity measured along
 matches our value
detected parallel to the minor axis (Fig. 6).
The galaxy has some OIII emission and is detected in H (Macchetto et al. [1996]). The scatter in the velocities is probably due to
this component. The velocity dispersion profile agrees with the
central value (185 km s-1) of Faber et al. ([1989]). The kinematic data of
Carollo & Danziger ([1994]) are however completely off, being 50 to 70 km s-1
larger (Fig. 6). The fact that their major and minor
axis data do not agree suggests that this dataset is not reliable.
The galaxy shows a slowly declining velocity dispersion profile, with
low rotation, small h3 and slightly positive h4 values. The
systematic differences with the velocity dispersion profiles of Franx
et al. ([1989]) and Bertin et al. ([1994], Fig. 7) might be
partly due to the 1 arcsec slit used here.
As discussed in Balcells & Carter ([1993]), the inner region of this
galaxy is not relaxed. The differences between its two sides are real
and reflect the complex kinematics. Some template mismatching is
still present at
 30 arcsec.
The comparison with the velocity and velocity dispersion profiles of
Balcells & Carter ([1993]) is good within the errors; the  data of Jedrzejewski & Schechter ([1989]) are systematically on the
lower side.


Up: Orbital structure and mass
Copyright The European Southern Observatory (ESO)


