

Up: A survey of the
Subsections
Here we give brief notes on many individual sources.
We have checked against existing surveys of maser and thermal lines,
and surveys of 5 GHz continuum in the galactic plane in order to look
for any associations.
05382+3547. We detected the 6.7 GHz methanol feature at velocity
0-24.1 km s-1. The CO(1-0) emission was found towards this source
at -19.2 km s-1 and possibly at -10.2 km s-1
(Wouterloot & Brand 1989).
06061+2151. The methanol features at velocities -8.7 and
-5.5 km s-1 lie well within the velocity range -13 to
0 km s-1, where strong water maser emission was observed
(Wouterloot et al. 1993). The CO (1-0) line at velocity
-1.6 km s-1 found by Wouterloot & Brand (1989) is slightly
redshifted relative to the methanol line.
Molinari et al. (1996) found the ammonia lines at -0.5 km s-1.
18061-1927. We found the methanol emission in the velocity interval
14 to 18 km s-1. Codella et al. (1995) detected the water maser line
at 24.5 km s-1.
18111-1729. Walsh et al. (1997) did not found the methanol emission
with a 3 detection limit of 1 Jy. We detected a 6.4 Jy feature
at 48.5 km s-1.
This suggests that the source is variable.
It is likely that the source is associated with CO emission
at 54 km s-1 quoted by Jaffe et al. (1981). The water masers were found
at quite different velocities of -21 km s-1 (Jaffe et al. 1981) and
-1.6 km s-1 (Cesaroni et al. 1988).
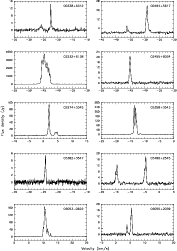 |
Figure 1:
The 6.7 GHz methanol maser spectra for all detections listed in the paper |
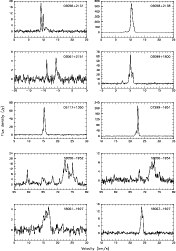 |
Figure 1:
continued |
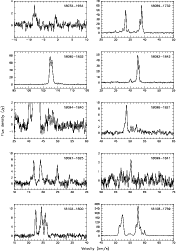 |
Figure 1:
continued |
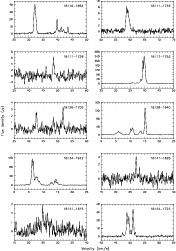 |
Figure 1:
continued |
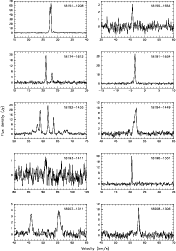 |
Figure 1:
continued |
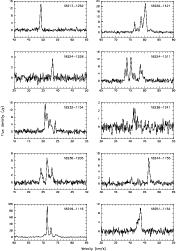 |
Figure 1:
continued |
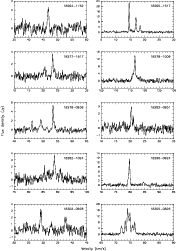 |
Figure 1:
continued |
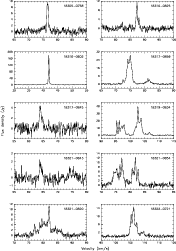 |
Figure 1:
continued |
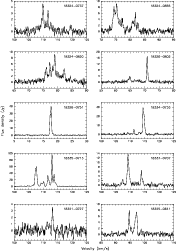 |
Figure 1:
continued |
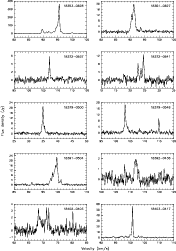 |
Figure 1:
continued |
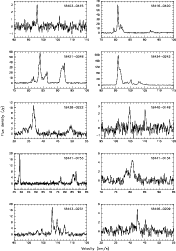 |
Figure 1:
continued |
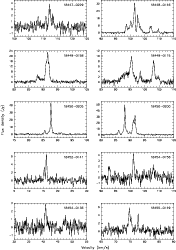 |
Figure 1:
continued |
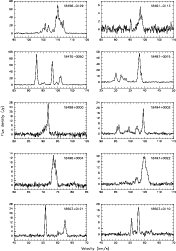 |
Figure 1:
continued |
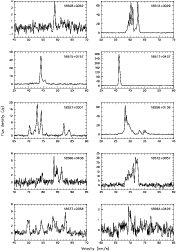 |
Figure 1:
continued |
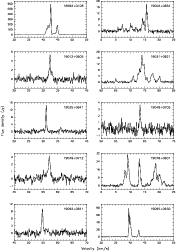 |
Figure 1:
continued |
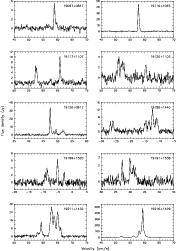 |
Figure 1:
continued |
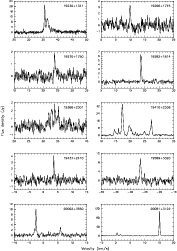 |
Figure 1:
continued |
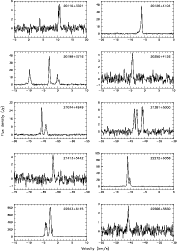 |
Figure 1:
continued |
 |
Figure 1:
continued |
18141-1626. The methanol emission of this source is peaked at
27 km s-1 and is within the velocity interval
of methanol emission
from 18141-1615 located about
 away.
At a position
 from the source, Jaffe et al. (1981) found
H2O maser with the main feature at 37 km s-1.
18155-1554. van der Walt et al. (1995) failed to detect
the methanol emission from this source to an upper limit of  5 Jy.
Backer et al. (1994) found an ultracompact HII region with the flux density
of 88.5 mJy at 5 GHz.
18264-1152. Bronfman et al. (1996) detected the CS(2-1)
emission at 43.6 km s-1 that is close to the velocity of
46.8 km s-1, where we found a single methanol feature.
18278-1009. We detected the methanol emission at 116.6 km s-1.
Molinari et al. (1996) found the ammonia lines at 94 and 98 km s-1.
18282-1024. This source has an associated ultracompact HII region
with the flux density of 96.2 mJy at 5 GHz (Backer et al. 1994).
18305-0826. van der Walt et al. (1995) did not detect the methanol
emission to an upper limit of  5 Jy. Easy detection of the methanol maser
in our survey suggests that the source is variable.
18321-0854. Towards this source Codella et al. (1995) found the water
maser emission at 79 km s-1 that is well within the velocity range of
methanol emission from 72 to 83 km s-1. Methanol emission at velocities
lower than 76 km s-1 appears to come from 18324-0855.
18324-0855. The methanol maser spectrum from this sources is contaminated by emission from 18321-0854. Both sources were observed at
the same epoch and we conclude that only emission at velocities lower than
76 km s-1 comes from 18324-0855.
18326-0802. This source probably coincides with an ultracompact
HII region with the flux density of 32.6 mJy at 5 GHz (Backer et al. 1994).
18337-0707. An ultracompact HII region with the flux density of 110 mJy at 5 GHz was found towards this source
(Backer et al. 1994).
18372-0537. Bronfman et al. (1996) found the CS(2-1) line at
111.5 km s-1 that is near to the velocity of
the methanol feature at
107.1 km s-1. This source is associated with an ultracompact HII region
with the flux density of 70.6 mJy at 5 GHz (Backer et al. 1994).
18372-0541. We detected the methanol emission at 24.6 km s-1
that is virtually the same as the velocity of CS emission
(23.6 km s-1) observed by Bronfman et al. (1996).
The source has an associated ultracompact HII region with the flux density of
76.1 mJy at 5 GHz (Backer et al. 1994).
18391-0504. An ultracompact HII region with the flux density of 53.1 mJy
at 5 GHz was possibly detected towards this source (Backer et al. 1994).
18402-0403. With a probability of 0.86 this source is associated with
5 GHz emission of 49.5 mJy (Backer et al. 1994).
18441-0134. This source has an associated ultracompact HII region
with the flux density of 3.6 mJy at 5 GHz (Backer et al. 1994).
18454-0136. The CS(2-1) emission found at 38.9 km s-1(Bronfman et al. 1996) is very close to the methanol feature detected
here at 40.8 km s-1. Backer et al. (1994) identified
an ultracompact HII region with the flux density of 14.7 mJy at 5 GHz.
18527+0301. Towards this source the ammonia lines were found
(Molinari et al. 1996) at 76 km s-1, i.e. exactly within the methanol
emission velocity range 70 to 85 km s-1.
18577+0358. We detected the methanol emission in the velocity interval
49 to 63 km s-1. The CS(2-1) emission was found at 52.9 km s-1(Bronfman et al. 1996). The H2O maser emission is centred at 45 km s-1(Hofner & Churchwell 1996). Towards this source two ultracompact HII regions
with flux densities of 42.5 and 345.3 mJy at 5 GHz were found (Backer et al. 1994).
18592+0426. The CS(2-1) emission was found at 83.5 km s-1(Bronfman et al. 1996), whereas we observed the methanol emission in the
velocity range from 69 to 71 km s-1. An ultracompact HII region of the flux
density of 21.3 mJy at 5 GHz was found (Backer et al. 1994).
19048+0705. H2O maser was found at 66.7 km s-1 (Scalise et al. 1989), whereas we found a methanol feature at 63.4 km s-1.
19097+0847. We detected the methanol emission at
58.8 km s-1, while
Bronfman et al. (1996) found the CS(2-1) emission at 57.3 km s-1.
The H2O maser emission is centred at 50 km s-1(Hofner & Churchwell 1996).
19191+1538. Bronfman et al. (1996) found the CS(2-1) emission at
25.8 km s-1 that is close to the velocity interval of methanol emission
from 26 to 33 km s-1.
19266+1745. The methanol line at 10 km s-1 is near to the CS(2-1)
emission at 5 km s-1 found by Bronfman et al. (1996).
19282+1814. The methanol emission at 18.7 km s-1 is likely to be
associated with a source of the CS(2-1) emission at 23.6 km s-1(Bronfman et al. 1996) and the ammonia lines at 24.1 km s-1(Molinari et al. 1996).
19366+2301. The CS(2-1) emission found at 32.9 km s-1(Bronfman et al. 1996) is well within the velocity interval of methanol
emission from 31 to 36 km s-1.
19437+2410. The CS(2-1) emission found at 4.9 km s-1(Bronfman et al. 1996) is near to the velocity of the methanol feature
at 3.6 km s-1.
20110+3321. We found the methanol emission at 4.0 and 10.7 km s-1.
The H2O maser emission was detected in the velocity range
from 13.6 to 18.6 km s-1 with the peak flux of 72 Jy at 16.4 km s-1,
whereas the 1667 MHz OH maser line was found at 7.4 km s-1(Lewis & Engels 1993).
21413+5442. The methanol emission was found at -61.6 km s-1in the survey. The 1612 and 1665 MHz OH emission was reported at
-61 km s-1 (Cohen et al. 1988). The excited OH maser emission
at 4765 MHz (Cohen et al. 1991) and at 6035 MHz (Baudry et al. 1997)
was found near -62 km s-1. Scalise et al. (1989) reported the
H2O maser centred at about -60 km s-1. The CO(1-0) emission was
found at -64 km s-1 (Wouterloot & Brand 1989). The CS(2-1) emission
at the same velocity was reported (Bronfman et al. 1996).
22566+5830. We found a single methanol feature at -45.7 km s-1.
The CO(1-0) emission was detected at -50.5 km s-1(Wouterloot & Brand 1989). The CS(2-1) line at nearly the same velocity
of -50.3 km s-1 was reported by Bronfman et al. (1996).
Wouterloot et al. (1993) found the H2O maser emission in the velocity
range from -67 to -40 km s-1.
23139+5939. The 6.7 GHz methanol line was detected in the velocity
range from -42 to -37 km s-1. Bronfman et al. (1996) found the
CS(2-1) line at -44.7 km s-1. Wouterloot et al. (1993) found
the H2O maser emission in the velocity range from -57 to -31 km s-1.
Most of early observations of the 6.7 GHz methanol masers were carried out
at different epochs in 1991 and 1992 (Menten 1991;
MacLeod & Gaylard 1992;
Gaylard & MacLeod 1993; Schutte et al. 1993;
Caswell et al. 1995;
van der Walt et al. 1995). Subsequent surveys were made in 1993-1994
(Lyder & Galt 1997;
Walsh et al. 1997) and in 1995 (Slysh et al. 1999).
Therefore, a comparison of those observations with our own data can provide
some information on the variability of methanol masers on time-scales
of 4 and 7-8 years.
00338+6312. MacLeod et al. (1998) first reported the methanol emission.
They found a double-peaked spectrum with the main feature of
8.1 Jy at velocity -22.7 km s-1. Slysh et al. (1999) reported
the peak flux value of 10 Jy, but our value is 14 Jy.
This suggests that the source is variable.
00494+5617. The 6.7 GHz maser was first reported by Slysh et al. (1999).
Their peak flux density of a feature at -29 km s-1 was 12 Jy, whereas
our peak value is 24 Jy. We found a new feature at -36 km s-1.
This suggests that the source is strongly variable.
02455+6034. The methanol maser with a double peaked spectrum was
discovered by Lyder & Galt (1997). Our data indicate that
the feature at -45 km s-1 decreased from 35 to 21 Jy, whereas that
at -42 km s-1 disappeared after  4.5 years, suggesting that
the source is strongly variable. This source was also
observed by Slysh et al. (1999), who listed in their Table 1,
a 24 Jy peak flux density for -45.3 km s-1 feature,
but a lower value of 17 Jy is shown in their Fig. 1.
05274+3345. Our methanol spectrum of this source is only slightly
different from that reported by Gaylard & MacLeod (1993). Comparison with
data published by Slysh et al. (1999) suggests that at least the main
feature at 4 km s-1 exhibits a strong variation.
05358+3543. Menten (1991) found the 6.7 GHz emission at the position
of S231 that is
 away from the IRAS position.
Our spectrum consists of 3 strong narrow features (0.10 - 0.14 km s-1
full width to half power (FWHP)). A weaker emission is present over
the velocity interval of
  5 km s-1, similar to that reported by
Menten (1991). He obtained the peak flux density of 208 Jy, whereas our value
is 256 Jy, indicating that the source is variable.
05480+2545. We found two emission complexes in the same velocity
range as reported by Slysh et al. (1999). However, their data on this
source are uncertain as the peak flux density given in their Table 1 is
obviously different from that shown in their Fig. 1.
06053-0622. Our peak flux density of 166 Jy is virtually the same as
that reported by Menten (1991).
Caswell et al. (1995) published the methanol
spectrum that is completely different from ours. This suggests that
the source is strongly variable.
06055+2039. The methanol feature at velocity 5.5 km s-1 appears to
be non-variable as compared to the data published by Menten (1991)
and
Caswell et al. (1995). However, the intensity of the feature at 4 km s-1
measured by Caswell et al. (1995) was about twice as large as our value of 17 Jy. No methanol emission was found by
Walsh et al. (1997) with a sensitivity
limit of 5 Jy. It appears that at least 4 km s-1 feature is
strongly variable.
06056+2131. We detected the methanol spectrum composed of two
narrow features (0.12 km s-1 FWHP) similar to those
reported by Caswell et al. (1995). The maser feature at 11 km s-1
is a sidelobe response to 06058+2138 (Caswell et al. 1995;
Slysh et al. 1999).
06058+2138. The intensity and shape of the methanol spectrum observed
in our survey are almost unchanged as compared to the observations by
Menten (1991)
and Caswell et al. (1995).
06099+1800. The same comment as for 06058+2138.
06117+1350. Menten (1991) found a methanol feature at 15 km s-1about twice as strong as in our and in Caswell's et al. (1995)
spectra. The source may be variable.
07299-1651. MacLeod & Gaylard (1992) reported a 42 Jy peak flux
density of methanol emission, whereas Caswell's et al. (1995) value was
162 Jy. Walsh et al. (1997) observed the strongest feature of 180 Jy,
but our value is 217 Jy. Evidently, the intensity is variable while
the shape of the spectrum is almost unchanged since its discovery.
18056-1952. This source is
 and
and
 away from W31(1) (Menten 1991) and 10.47+0.03
(Caswell et al. 1995),
respectively. Menten's observations gave the peak flux
density of 823 Jy. Our methanol spectrum has a similar shape to that
observed by Caswell et al. (1995), with an exception of the feature at
75 km s-1 which intensity decreased from 61 Jy to 17 Jy.
The methanol spectrum is strongly confused by the emission
of the nearby sources 10.45-0.02 and 10.48+0.03 (Caswell et al. 1995).
18056-1954. Caswell et al. (1995) obtained a similar methanol spectrum
at the position of 10.45-0.02 that is
 away from the IRAS position, but the intensity was about twice as large as ours. The spectrum is
strongly confused by the emission from 10.47+0.03 and 10.48+0.03
(Caswell et al. 1995).
18067-1927. A single methanol feature of 20 Jy at 24 km s-1
was discovered by Schutte et al. (1993). Its intensity of 18 Jy was
reported by Walsh et al. (1997), while our value is 15 Jy.
These differences may be due to variability but an effect of
calibration uncertainties cannot be excluded.
18089-1732. Menten (1991) first discovered this methanol source.
The spectrum published by
Caswell et al. (1995) is quite similar to that obtained in our survey, but some individual features are considerably variable.
18090-1832. Within the calibration uncertainties the peak intensity
of the methanol maser measured in our survey is the same as reported elsewhere
(Menten 1991;
Caswell et al. 1995).
18092-1842. The general shape of the methanol spectrum taken in our survey is similar to that reported by
Caswell et al. (1995). When comparing our data with those published by
Menten (1991)
and Caswell et al. (1995), we note a
gradual decrease of maser intensity.
18094-1840. A weak methanol emission detected in the velocity
range from 45 to 49 km s-1 comes from this source (Caswell et al. 1995).
At velocities lower than 45 km s-1 our spectrum is contaminated
by the emission from 18092-1842.
18097-1825. We found the methanol emission in the same velocity
range as observed by Menten (1991). Our spectrum taken with a larger
beamwidth is strongly confused by emission from two nearby sources
12.20-0.11 and 12.20-0.12 (Caswell et al. 1995).
18099-1841. The main methanol feature at 60.2 km s-1 detected in
our survey has the same intensity as reported by Walsh et al. (1997).
18102-1800. We detected at least 6 narrow methanol features
(<0.20 km s-1 FWHP). The emission in the velocity interval
52 to 59 km s-1, also reported by Slysh et al. (1999), comes from 18108-1759.
18108-1759. This methanol source is
 away from W33B
discovered by Menten (1991) and
 away from 12.68-0.18
published by Caswell et al. (1995). In consequence, our peak flux density
is lowered by a factor of about two.
18110-1854. Our methanol spectrum is similar to that published
by Caswell et al. (1995). Within the measurement errors our peak value is
the same as reported by Menten (1991).
18117-1753. The peak flux densities of methanol maser measured
by Menten (1991)
and Caswell et al. (1995) were 327 and 317 Jy respectively,
but our value of 242 Jy is considerably lower. This suggests that the
source is variable.
18128-1640. Our methanol spectrum is similar to that discovered
by Slysh et al. (1999), but the intensity of the feature at 15.3 km s-1
decreased from 200 Jy to 135 Jy. This suggests that at least this main
feature is variable.
18134-1942. The methanol maser was found by Schutte et al. (1993),
who reported the peak flux of 248 Jy. Walsh et al. (1997)
reported the peak
value of 160 Jy, while our value is 116 Jy. Furthermore, the intensities
of individual features in our spectrum differ significantly from those
published by Schutte et al. (1993). This source is strongly variable.
18141-1615. This methanol source was undetected by van der Walt
et al. (1995) with a sensitivity limit of about 5 Jy.
Walsh et al. (1997)
found a weak (2.3 Jy) emission in the velocity range from 19 to 35 km s-1.
We detected the methanol emission of similar intensity.
18144-1723. MacLeod et al. (1998) detected the methanol emission
in the velocity interval 48 to 53 km s-1 with the peak flux
density of 24 Jy. Our peak value of 33 Jy is higher, possibly due to a higher
spectral resolution.
18151-1208. A single methanol feature of 46 Jy at 27.8 km s-1was discovered by van der Walt et al. (1995).
Slysh et al. (1999) reported the peak flux density of 72 Jy. Within the measurement accuracy our data give
the same peak flux density, but the spectrum has three features. The source is
likely variable.
18174-1612. We observed the main methanol feature of 19 Jy at velocity
20.9 km s-1. Menten (1991) obtained the peak flux density of 49 Jy,
while Caswell's et al. (1995) value was 39 Jy. This suggests that the
maser intensity decreased. The shape of our spectrum is similar to
that published by Caswell et al. (1995).
18182-1433. We detected a methanol feature with the peak flux density
of 24 Jy similar to that reported elsewhere (Menten 1991;
Caswell et al. 1995).
However, we note significant differences in the relative intensities of
individual features when comparing our spectrum with that published by
Caswell et al. (1995).
18196-1331. The methanol feature of 20 Jy at 20.5 km s-1
detected in our survey has approximately the same intensity as that
reported by MacLeod & Gaylard (1992)
and Caswell et al. (1995). This
suggests that the source is not variable.
18217-1252. Menten (1991) detected the methanol emission with
the peak flux density of 28 Jy. During observations by Caswell et al. (1995)
this peak was 23 Jy. Our value of 14 Jy suggests that the emission has
decreased gradually over about 8 years' period.
18232-1154. This methanol source is offset by
 to
the position observed by Menten (1991), who found the methanol emission
with the peak flux density of 24 Jy. Caswell et al. (1995) found two sources
19.47+0.17 and 19.48+0.15 with spectra contaminated by the emission from other
nearby sources. Our spectrum is similar to that of 19.48+0.15.
18236-1241. The methanol emission discovered by Slysh et al. (1999)
had a single feature with the peak flux density of 5 Jy. Our spectrum contains
at least two narrow features of flux density of 2.3 Jy.
18236-1205. Walsh et al. (1997) found the methanol emission in the
velocity range 24 to 31 km s-1 with the peak flux density of 26 Jy.
We obtained quite different spectrum with the peak flux density of 6.7 Jy.
This allows us to conclude that the source is strongly variable.
18244-1155. Comparing our methanol data with those published by
Caswell et al. (1995) we note a decrease of intensity by a factor of about two.
18249-1116. Menten first detected this methanol source with
the peak flux density of 112 Jy. Our spectrum with the peak flux of 94 Jy is
similar to that published by Caswell et al. (1995) where the peak flux
density was 100 Jy. The source exhibits only a weak variation of intensity,
if any.
18265-1517. This methanol source was first detected by
Walsh et al. (1997). Our measurements indicate that within the uncertainty
of about 15% the methanol emission is unchanged.
18282-0951. The peak flux density ( 15 Jy) of methanol emission previously reported
(Menten 1991; Caswell et al. 1995) was about
a factor of 5 higher than that measured in our survey. This suggests that
the source is variable.
18290-0924. The methanol emission had the peak flux density of
21 Jy during discovery observations (Schutte et al. 1993). Our value
of 12 Jy is the same as reported by Walsh et al. (1997). This source may
be variable.
18310-0825. Our data indicate that this source has the methanol
maser with the peak flux density of 12 Jy that is nearly the same as
reported by Schutte et al. (1993). However, data presented by
Walsh et al. (1997)
and Slysh et al. (1999) suggest that the source
is strongly variable.
18316-0602. A prominent methanol feature at 42 km s-1
has the same intensity as published by Slysh et al. (1999). Previous
observations gave its value of a factor of two lower
(van der Walt et al. 1995;
Walsh et al. 1997). We detected a broad emission from 38 to
44 km s-1 about twice as strong as that observed by Walsh et al. (1997).
18317-0845. Schutte et al. (1993) first detected the methanol
emission with the peak flux of 12 Jy. Other observations indicate
a significant decrease of intensity by a factor of two (Walsh et al. 1997;
Slysh et al. 1999). Our data give the peak flux density of 4.4 Jy and
confirm a gradual decrease of intensity.
18319-0834. We detected the methanol emission in the velocity
range from 95 to 108 km s-1, similar to that reported by
Menten (1991). Our spectrum is quite different from that published by
Caswell et al. (1995). A mean level of maser emission in the velocity
range 95-100 km s-1 measured in our survey was comparable to that
observed by Caswell et al. (1995), but emission at 101-108 km s-1
decreased about twice.
18324-0737. The methanol emission with the peak flux density of 3 Jy
was first detected by Menten (1991). Observations by
Caswell et al. (1995)
provided the peak flux of about 11 Jy. In our survey the shape of the spectrum
was generally similar to that published by Caswell et al. (1995), but
the peak flux density decreased to 4.6 Jy. This suggests that the
source is variable.
18324-0820. Schutte et al. (1993) first found the methanol emission
in the velocity range 75 to 81 km s-1 with the peak flux density of
28 Jy. In the same velocity range a similar peak flux was reported
by Slysh et al. (1999), but individual features appeared to be variable.
Walsh et al. (1997) observed the maser emission in the velocity range
58 to 81 km s-1 with the peak flux density of 26 Jy.
The present observations revealed the emission in the velocity range 75 to
85 km s-1 with the peak flux density of 9.2 Jy. We conclude that the source is strongly variable.
18334-0733. The methanol emission of 33 Jy at 114.5 km s-1was first detected by van der Walt et al. (1995).
Slysh et al. (1999) found
the peak flux of 42 Jy at similar velocity. Our peak value of 29 Jy
is nearly the same as measured by van der Walt et al. (1995).
We detected two weak features at 111 and 113 km s-1 not seen in other observations.
The source appears to be variable.
18335-0713. The source was first detected at 6.7 GHz by Menten (1991),
who reported the peak flux density of 89 Jy. A similar value of 82 Jy was
published by Caswell et al. (1995). We note that their spectrum is very
similar to ours, with the peak flux density of 97 Jy.
18341-0727. We detected the methanol line at the same velocity as
Slysh et al. (1999). Our peak flux of 3.5 Jy is a factor of 4.5 lower than
their value. This suggests that the maser is variable.
18345-0641. van der Walt et al. (1995) found the methanol emission
in the velocity range from 94 to 100 km s-1. Our observations indicate
that their main peak of  45 Jy at
  99 km s-1 decreased to
about 2 Jy, while a low intensity emission in the velocity range 94 to
98 km s-1 is now dominated by two well-separated features.
We conclude that the source is strongly variable.
18353-0628. The shape of the methanol spectrum taken in our survey
is generally the same as observed by Walsh et al. (1997). However, the main
feature at 96 km s-1 increased from 225 Jy (Walsh et al. 1997) to
364 Jy at the time of our observations. This suggests that the source is variable.
18361-0627. Schutte et al. (1993) first detected the methanol emission
from this source. They listed the peak flux density of 54.1 Jy, whereas their
Fig. 2 indicates a value of  80 Jy. The intensity of the main feature at
92 km s-1 obtained by Walsh et al. (1997) was 7.4 Jy, while our value
is 20 Jy. This suggests that the source is strongly variable.
18379-0500. This methanol source was first discovered by
Slysh et al. (1999). In their Table 1 they listed the peak flux density of 41 Jy, but their
Fig. 1 indicates a value of  27 Jy at velocity 35 km s-1. We found a 21 Jy feature at the same velocity.
18379-0546. van der Walt et al. (1995) found a single methanol feature
of 10 Jy at about 104 km s-1. Slysh et al. (1999) found a similar
intensity of this feature and detected another feature at 115 km s-1.
Our data indicate that the latter feature has the same intensity as reported by
Slysh et al. (1999), whereas the intensity of the feature at 104 km s-1
increased by a factor of two. The source is likely variable.
18403-0417. Towards this source a weak ( 3 Jy) methanol emission
was detected in the velocity range 94 to 102 km s-1
(Menten 1991;
Caswell et al. 1995;
Walsh et al. 1997). With our beamwidth
the spectrum is contaminated by the emission from the nearby source 28.15+0.00
(Caswell et al. 1995), which is
 away from the IRAS position,
nevertheless, our peak flux density is about twice larger than that reported
by Caswell et al. (1995).
18416-0420. The methanol maser was first found by Schutte et al.
(1993). Their spectrum had a single asymmetric feature at 81 km s-1with the peak flux density of 59 Jy. Observations by Walsh et al.
(1997) gave the peak value of 62 Jy, exactly the same as ours.
The peak flux density of 75 Jy measured by Slysh et al. (1999) differs by about
18% from all previous values. This suggests that the methanol emission
does not change at all. Our observations revealed that there are several weak
features in the velocity ranges of 79-83 and 91-93 km s-1.
18421-0348. The source was first detected at the 6.7 GHz maser line
by Menten (1991),
who reported the peak flux density of 85 Jy. Caswell et al. (1995) found a peak flux density of 73 Jy, while our value is 58 Jy.
A comparison of our spectrum with Caswell's et al. spectrum indicates that
individual features are variable.
18434-0242. The methanol spectrum obtained in our survey does not
differ from that observed earlier (Menten 1991;
Caswell et al. 1995).
Emission at velocities higher than 102 km s-1 comes from two nearby
sources (Caswell et al. 1995).
18440-0148. Menten (1991) first detected the methanol emission with
the peak flux density of 4 Jy. Data published by Caswell et al. (1995) indicate
that the main feature at 105 km s-1 decreased from 8 Jy to 3 Jy at the epoch of our measurements.
18441-0153. We detected the methanol emission
in the velocity ranges of 47-49 and 70-89 km s-1 with the peak flux
densities of 19 and 8 Jy respectively. With a smaller antenna beam,
Caswell et al. (1995)
found two separate sources 30.78+0.23 with the peak flux
density of 24 Jy at 49 km s-1 and 30.79+0.20 with the peak flux density
of 23 Jy at 86 km s-1. A comparison of our observations with
Caswell's et al. data suggests that the first source does not vary at all,
but the intensity of methanol emission from the second source decreased
by about a factor of three.
18443-0231. Menten (1991) reported the methanol emission in the
velocity range 100 to 115 km s-1, exactly the same as we observed.
Caswell et al. (1995) found two sources; 30.20-0.17 with the methanol
emission of about 18.7 Jy at velocities lower than 111 km s-1 and
30.22-0.18 at velocities greater than 111 km s-1. Our peak value
of the feature at 108 km s-1 is the same as reported by
Caswell et al. (1995), whereas the intensity of 113 km s-1 feature is about twice lower.
18446-0209. The peak flux density of 5 Jy was reported by
Menten (1991).
The methanol spectrum published by Caswell et al. (1995)
contains several weak features in the velocity range 36 to 49 km s-1and the peak value of 7.5 Jy at velocity 42.4 km s-1. We detected
a 4.8 Jy feature at nearly the same velocity.
18447-0229. The maser emission from this source is uncertain.
Caswell et al. (1995) found the emission in the velocity range
111 to 115 km s-1 with the peak of 11.7 Jy at 113 km s-1 at
offset of
 to the IRAS position. We found emission at similar velocity; it was about four times weaker than that reported by
Caswell et al. (1995).
18448-0146. The methanol spectrum towards this source is nearly
the same as that reported by Schutte et al. (1993) towards 18446-0150.
Angular separation between both sources is
 .
We observed 18446-0150 at the same epoch and obtained the intensity of the emission about three times lower than that measured from 18448-0146.
Walsh et al. (1997) reported a 2.4 Jy methanol feature from 18446-0150.
We conclude that the strongest methanol emission comes from 18448-0146.
18449-0158. We detected the methanol emission in the velocity
range 87 to 93 km s-1.
 away from the IRAS position,
a maser source with the peak flux density of 68 Jy at 92 km s-1 was
found (Caswell et al. 1995). The shape of the spectrum
and the intensity measured in our survey are quite different from that published
by Caswell et al.
18449-0115. The methanol emission from this source was first detected
by Schutte et al. (1993).
Our spectrum is quite similar to
that published elsewhere (Schutte et al. 1993;
Caswell et al. 1995). This
suggests that the source is not variable.
18450-0205. The general shape of the methanol spectrum obtained in the
survey is similar to that observed by Caswell et al. (1995),
but the intensity
decreased by a factor of two.
18450-0200. Our methanol spectrum is contaminated by the emission from 18450-0205. Only emission at velocities larger than 90 km s-1 comes from the source.
The peak flux density published by Caswell et al. (1995) is about
twice higher than ours.
18452-0141. The methanol spectrum first published by Schutte et al.
(1993) had two narrow features in the velocity range 15 to 17 km s-1.
Our spectrum is quite similar, but a redshifted feature decreased in intensity
by a factor of two. Walsh et al. (1997) reported that this feature had
the peak flux density of 3 Jy. This suggests that the source is variable.
18454-0156. The methanol emission was found by Menten (1991)
and
Caswell et al. (1995)
 away from the IRAS position.
Due to the offset position our peak flux density of 4.3 Jy differs
significantly from values of 21 and 18 Jy reported in the papers above.
18456-0129. Menten (1991)
found the methanol emission in the velocity
range 104 to 114 km s-1 with the peak flux density of 87 Jy. The general
shape of the spectrum published by Caswell et al. (1995) is similar to ours,
but the intensities of some individual features are different. The source is possibly variable.
18470-0050. Our methanol spectrum is very similar to that obtained
towards 18470-0044 by van der Walt et al. (1995). However, in their Table 1
they listed this source as non-detection, whereas in their Table 2 the methanol
line parameters are given for 18470-0049. We made the observations
of all three sources at the same epoch. It appeared that the strongest
emission comes from 18470-0050.
18487-0015. The methanol emission first found by Menten (1991) had
the peak flux density of 46 Jy. A similar value of 47 Jy was reported by
Caswell et al. (1995). Our measurements give the same peak flux density
and the spectrum similar to that published by Caswell et al. (1995).
However, we note a considerable decrease of intensity of the features at
about 33 km s-1.
18488+0000. The methanol maser from this source was discovered by
van der Walt et al. (1995). Our observations give a spectrum of the same
shape as that reported by van der Walt et al. (1995)
and Slysh et al. (1999).
The peak flux density of the main feature at 92 km s-1 increased from
16 Jy (van der Walt et al. 1995)
to 21 Jy (Slysh et al. 1999), whereas our peak
value is 27 Jy. This suggests that the source is variable.
18494+0002. The methanol emission was found in the velocity range
95 to 106 km s-1 (Caswell et al. 1995). We found the emission at the
same velocities but intensities of individual features are quite different.
18496+0004. We found the maser emission with the peak flux density of
13 Jy. Similar values of 10 and 12 Jy were reported by Menten (1991)
and
Caswell et al. (1995) respectively. We also note that the shape of the spectrum
is the same as published earlier. This source is likely to be non-variable.
18497+0022. The general shape of the methanol spectrum obtained here
is similar to that reported by Slysh et al. (1999). Differences in intensities
of individual features between Slysh's et al. observations and our data can result from our higher spectral resolution and sensitivity.
18507+0121. Schutte et al. (1993) detected the methanol emission at
velocities of 55-64 km s-1. Comparing their spectrum with ours,
we see that the relative intensities of two prominent features
significantly changed.
18507+0110. Menten (1991) discovered the methanol emission with the peak
flux density of 32 Jy. Observations by Caswell et al. (1995) provided the
peak value of 29 Jy, while we obtained a lower value of 18 Jy.
This suggests that the source is variable.
Caswell's et al. data indicated that emission at 56 km s-1 comes
from a nearby source.
18515+0157. We found the methanol emission in the velocity range
44 to 47 km s-1, which is similar to that reported by Menten (1991).
Our peak flux density is 35 Jy, which is significantly lower than 50 Jy
and 56 Jy, measured by Menten (1991) and Caswell et al. (1995) respectively,
suggesting that this source is variable.
18517+0437. Schutte et al. (1993) found the methanol emission with
the peak flux density of 298 Jy at velocity 41 km s-1. We obtained nearly
the same value of 279 Jy. The present observations revealed a weak ( 7 Jy)
emission near 45-46 and 51 km s-1.
18556+0136. Menten (1991) first detected the methanol emission
in the velocity range 27 to 34 km s-1 with the peak flux density of
107 Jy. The methanol spectrum published by Caswell et al. (1995) is quite
different from that obtained here. This suggests that the source is variable.
18566+0408. Slysh et al. (1999) first found the methanol maser in this
source. Their spectrum is similar to ours, obtained with higher
spectral resolution and sensitivity.
18572+0057. van der Walt et al. (1995) detected the methanol emission
with the peak flux density of 21 Jy. Our data indicate that the spectrum is
composed of several narrow features of intensities comparable to those reported
by Slysh et al. (1999). This source may be weakly variable.
18592+0108. This source was detected in the 6.7 GHz methanol line
by Menten (1991), who found the peak flux density of 556 Jy. The same value
was found by Caswell et al. (1995). Our peak flux density is 595 Jy.
This suggests that the main feature does not vary. However, other features
show considerable changes.
19002+0654. The methanol maser was discovered by Schutte et al. (1993).
They found two features in the velocity interval of 13-17 km s-1.
Our observations revealed much broader velocity range of 5-16 km s-1,
where several weak features are seen.
19035+0641. Menten (1991) discovered the methanol maser in the velocity
range 30 to 37 km s-1 with the peak flux density of 14 Jy. Caswell et al.
(1995) reported a similar peak value of 17 Jy. We found the
emission in the same velocity interval with the peak flux density of 15 Jy.
This source is non-variable.
19078+0901. We obtained a very similar methanol spectrum as that discovered by
Menten (1991). His peak flux density of 28 Jy is close to
our value of 31 Jy. Caswell et al. (1995) found a cluster of three sources
with methanol emission in the velocity range 6 to 22 km s-1.
A comparison of our data with those quoted above suggests that the source is non-variable.
19092+0841. MacLeod et al. (1998) discovered the methanol emission
with the peak flux density of 11.6 Jy at 55 km s-1. We obtained a similar
spectrum with the peak value of 10 Jy, which suggests that the source is non-variable.
19095+0930. Menten (1991) discovered the methanol emission in the velocity
range 30 to 44 km s-1 with the peak flux density of 152 Jy.
In the same velocity interval, Caswell et al. (1995) found the peak flux
density of 144 Jy. The present survey indicates that the emission at velocity
40 km s-1 decreased by a factor of two, but that at velocity
43 km s-1 has the same intensity as reported by Caswell et al. (1995).
19110+1045. The methanol emission discovered by Menten (1991) had
the peak flux density of 42 Jy. Observations by Caswell et al. (1995) revealed
a decrease of the peak value to 33 Jy. Our data give the peak value of 45 Jy, which is very similar to that reported by
Menten (1991). This suggests that
the emission from this source is variable.
19117+1107. We found the methanol emission in the velocity range
57 to 67 km s-1 which is similar to that reported by Menten (1991). Our
peak flux density of 10 Jy is by a factor of 1.5 lower than that listed by
Menten (1991). The data published by Caswell et al. (1995) indicated that
the emission at about 57 km s-1 comes from 45.47+0.05, which is located
 away from IRAS source 19120+1103.
19120+1103. The methanol emission from this source was first discovered
by Menten (1991). Our data confirm that the emission at velocities larger
than 59 km s-1 is confused by the source 19117+1107, named 45.47+0.13
by Caswell et al. (1995).
19120+0917. Schutte et al. (1993) first detected the methanol maser.
They found a spectrum with two features at 48 and
52 km s-1 and flux densities of about 10 Jy. Our observations revealed
a quite different spectrum with the peak value of 34 Jy at about 48 km s-1.
This suggests that the source is strongly variable.
19216+1429. The methanol emission detected towards this source is
likely to be a sidelobe response to W51 (Menten 1991;
Caswell et al. 1995) that is
 away from 19216+1429.
19230+1341. van der Walt et al. (1995) first detected the methanol
maser towards this source. Although their peak value of 24 Jy does not differ
significantly from ours, we note very large changes in the spectrum shape.
19410+2336. This source was discovered by Menten (1991), who
found the methanol emission in the velocity range 15 to 28 km s-1with the peak flux density of 103 Jy. Caswell's et al. (1995) observations
revealed the peak flux density of 42 Jy at 25 km s-1, whereas our data
show the strongest feature of 34 Jy at 17.3 km s-1 and the spectrum
is completely different. This suggests that the source is strongly variable.
19589+3320. The methanol emission with the peak flux density of 22 Jy at velocity -26 km s-1 was first detected by
Slysh et al. (1999). We found
the main feature of flux density of 9.8 Jy at the same velocity. This source
can be variable.
20062+3550. Slysh et al. (1999) discovered the methanol maser with
a single peak of flux density of 32 Jy at velocity -3 km s-1.
Our data indicate that the intensity of this feature decreased to 10 Jy and
a new feature appeared at 6 km s-1. This suggests that the source is variable.
20081+3122. The methanol emission with the peak flux density of 91 Jy
was first detected by Menten (1991). Our peak value is 109 Jy, suggesting
weak variations of this source, if any.
20126+4104. The methanol maser was first reported by MacLeod & Gaylard
(1992)
and their peak flux density was 7 Jy. Slysh et al. (1999) published
the methanol spectrum with two prominent features with the peak flux density
of 61 Jy. Our survey revealed a single asymmetric feature of the flux density
of 38 Jy. This suggests that the source is strongly variable.
20198+3716. This source was discovered in the 6.7 GHz line by Menten
(1991). His peak flux density of 54 Jy is higher than ours (39 Jy).
This is possibly due to variability.
20350+4126. Slysh et al. (1999) first reported the methanol maser from
this source. They found a feature of 10 Jy at velocity -4 km s-1.
We found a 4 Jy feature at the same velocity. This suggests that
the maser emission is variable.
21381+5000. Slysh et al. (1999) found the methanol emission in the velocity range from -45 to -39 km s-1 with the peak flux density of
19 Jy. Our observations revealed quite different spectrum with the peak value
of 7 Jy. This suggests that the source is strongly variable.
22272+6358. The methanol emission was first reported by Slysh et al.
(1999), who found the peak flux density of 109 Jy at -11 km s-1.
Their spectrum is similar to ours, with the peak value of 91 Jy.
22543+6145. This is one of the strongest sources of the 6.7 GHz
methanol emission discovered by Menten (1991). He reported the peak value of
1420 Jy, while our value is 815 Jy. This indicates that the intensity of
the main feature at -2.5 km s-1 decreased, whereas the intensities of
other features do not show notable variations.
23116+6111. Menten (1991) found the methanol emission in the velocity
range from -62 to -54 km s-1 with the peak flux density of 346 Jy.
Our peak value of the main feature at -56.3 km s-1 is 296 Jy. We found a
weak ( 4-9 Jy) emission at velocities -53 and -49 km s-1.
Individual features at velocities lower than -55 km s-1 appear to
be variable.
02219+6152. The 6.7 GHz methanol emission from this source was reported
by Slysh et al. (1999). With our beamwidth we also detected a weak ( 7 Jy) emission in the velocity range from -46 to -42 km s-1.
The spectrum shape and the velocity range of this emission are very
similar to those observed towards 02232+6138 (W3(OH)).
This emission appears to be a sidelobe response to W3(OH).
18021-1950. The methanol emission of 0.4 Jy reported by
Walsh et al. (1997) lies below our sensitivity limit.
18067-1921. A weak (0.7 Jy) methanol emission at velocity
20 km s-1 detected by Walsh et al. (1997) lies below our 3 upper limit.
A single feature observed at 24 km s-1 is a sidelobe response to 18067-1927.
18248-1158. Caswell et al. (1995) found a weak (0.4 Jy) methanol emission that lies below our 3 detection limit.
18335-0711. The methanol maser was reported by Caswell et al. (1995).
With our beamwidth this source is badly contaminated by 18335-0713.
18443-0210. The methanol emission with the peak flux density of 0.6 Jy was reported by
Walsh et al. (1997), but lies below our 3 detection
limit.
18470-0044. Slysh et al. (1999) reported the methanol emission
towards this source. We observed several nearby IRAS sources
and found that the strongest emission comes from 18470-0050.
19220+1432. Slysh et al. (1999) found the methanol emission with the peak
flux density of 10 Jy at velocity 60 km s-1. We did not find any emission above 3 upper limit of 1.8 Jy. This suggests that the source
is strongly variable.
19388+2357. Schutte et al. (1993) observed a 24.7 Jy methanol feature
at velocity 38 km s-1. The peak value measured by Slysh et al. (1999)
was 31 Jy. No emission was found in our survey with 3 upper limit
of 1.5 Jy. This suggests that the source is strongly variable.
22551+6139. MacLeod et al. (1998)
and Slysh et al. (1999) reported
the 6.7 GHz methanol emission. We detected the methanol emission towards
this source but its velocity range and the peak ratio of two features are
exactly the same as measured for 22543+6145. We conclude that this emission
is a sidelobe response to 22543+6145.


Up: A survey of the
Copyright The European Southern Observatory (ESO)
![]() detection limit of 1 Jy. We detected a 6.4 Jy feature
at 48.5 km s-1.
This suggests that the source is variable.
It is likely that the source is associated with CO emission
at 54 km s-1 quoted by Jaffe et al. (1981). The water masers were found
at quite different velocities of -21 km s-1 (Jaffe et al. 1981) and
-1.6 km s-1 (Cesaroni et al. 1988).
detection limit of 1 Jy. We detected a 6.4 Jy feature
at 48.5 km s-1.
This suggests that the source is variable.
It is likely that the source is associated with CO emission
at 54 km s-1 quoted by Jaffe et al. (1981). The water masers were found
at quite different velocities of -21 km s-1 (Jaffe et al. 1981) and
-1.6 km s-1 (Cesaroni et al. 1988).
![]() away.
At a position
away.
At a position
![]() from the source, Jaffe et al. (1981) found
H2O maser with the main feature at 37 km s-1.
from the source, Jaffe et al. (1981) found
H2O maser with the main feature at 37 km s-1. ![]() 5 Jy.
Backer et al. (1994) found an ultracompact HII region with the flux density
of 88.5 mJy at 5 GHz.
5 Jy.
Backer et al. (1994) found an ultracompact HII region with the flux density
of 88.5 mJy at 5 GHz.
![]() 5 Jy. Easy detection of the methanol maser
in our survey suggests that the source is variable.
5 Jy. Easy detection of the methanol maser
in our survey suggests that the source is variable.
![]() 7 Jy) emission in the velocity range from -46 to -42 km s-1.
The spectrum shape and the velocity range of this emission are very
similar to those observed towards 02232+6138 (W3(OH)).
This emission appears to be a sidelobe response to W3(OH).
7 Jy) emission in the velocity range from -46 to -42 km s-1.
The spectrum shape and the velocity range of this emission are very
similar to those observed towards 02232+6138 (W3(OH)).
This emission appears to be a sidelobe response to W3(OH). ![]() upper limit.
A single feature observed at 24 km s-1 is a sidelobe response to 18067-1927.
upper limit.
A single feature observed at 24 km s-1 is a sidelobe response to 18067-1927.
![]() detection limit.
detection limit.
![]() detection
limit.
detection
limit.
![]() upper limit of 1.8 Jy. This suggests that the source
is strongly variable.
upper limit of 1.8 Jy. This suggests that the source
is strongly variable.
![]() upper limit
of 1.5 Jy. This suggests that the source is strongly variable.
upper limit
of 1.5 Jy. This suggests that the source is strongly variable.