 |
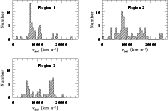
Figure 5: Histograms of heliocentric radial velocity for observed galaxies in the three sample regions. Bin width 500 km s-1 |
 |
Figure 6: Comparison of results for heliocentric radial velocity values determined from repeat observations |
 |
Figure 8:
The difference between results for velocity dispersions measured from repeat
observations, plotted against the mean S/N per
|
The measured value of velocity dispersion depends on the velocity dispersion profile in the
galaxy. Since the profile is not known for each galaxy, a general form must be assumed.
J![]() rgensen et al. (1995) established an aperture correction from kinematic models based
on the available literature data. They used the models to derive the equivalent circular aperture
for each rectangular aperture, and adopted a power law as the aperture correction to
rgensen et al. (1995) established an aperture correction from kinematic models based
on the available literature data. They used the models to derive the equivalent circular aperture
for each rectangular aperture, and adopted a power law as the aperture correction to ![]() .
The radius
.
The radius
![]() (in arcsec) of the equivalent circular aperture is found from
(in arcsec) of the equivalent circular aperture is found from
![]() ,
where w and l are the width and length of a rectangular aperture (slit).
J
,
where w and l are the width and length of a rectangular aperture (slit).
J![]() rgensen et al. (1995) correct the velocity dispersion to an aperture with a standard
physical size, and use a value for the normalising aperture size of 2
rgensen et al. (1995) correct the velocity dispersion to an aperture with a standard
physical size, and use a value for the normalising aperture size of 2
![]() = 1.19 h-1kpc (
= 1.19 h-1kpc (
![]() /100 km s-1 Mpc-1.) This means that the velocity dispersion
values are normalized to a velocity dispersion measured with an aperture of diameter 1.19
h-1 kpc, which is equivalent to 3.4 arcsec for a galaxy at the distance of the Coma cluster.
Baggley (1996) has shown that it is necessary to also take the effective radius
/100 km s-1 Mpc-1.) This means that the velocity dispersion
values are normalized to a velocity dispersion measured with an aperture of diameter 1.19
h-1 kpc, which is equivalent to 3.4 arcsec for a galaxy at the distance of the Coma cluster.
Baggley (1996) has shown that it is necessary to also take the effective radius ![]() into account
in the aperture correction, since the observed velocity dispersion of a galaxy depends on
into account
in the aperture correction, since the observed velocity dispersion of a galaxy depends on ![]() as well. For two galaxies of different sizes at the same distance observed through the same
aperture, the slit will cover more of the smaller galaxy and a different part of the galaxy profile
will therefore be sampled; this dependence of
as well. For two galaxies of different sizes at the same distance observed through the same
aperture, the slit will cover more of the smaller galaxy and a different part of the galaxy profile
will therefore be sampled; this dependence of ![]() on
on ![]() must be removed to ensure that
the velocity dispersion is truly a distance-independent quantity. We used Baggley's formula for
the aperture correction; it is a generalisation of the formula of J
must be removed to ensure that
the velocity dispersion is truly a distance-independent quantity. We used Baggley's formula for
the aperture correction; it is a generalisation of the formula of J![]() rgensen et al. (1995)
to take
rgensen et al. (1995)
to take ![]() into account:
into account:
Equation (1) was used to calculate the corrections.
The slit widths in the various instrumental setups are as shown in Table 2.
For the length of the slit in the aperture, what is important is the extent of the galaxy along the
slit, i.e. the length from which the one-dimensional spectrum was extracted; the spectrum was
extracted out to the point where the luminosity had fallen to 10% of its peak value.
The ![]() value for each galaxy was taken from the results of the fitting and seeing-correction
programs applied to the photometric data, as described in Müller (1997) and
Müller et al. (1999).
The value of the heliocentric redshift
value for each galaxy was taken from the results of the fitting and seeing-correction
programs applied to the photometric data, as described in Müller (1997) and
Müller et al. (1999).
The value of the heliocentric redshift
![]() was
taken to be 6917 km s-1 (Zabludoff et al. 1993),
and
h = 1
was used in the conversion of km s-1 to kpc.
was
taken to be 6917 km s-1 (Zabludoff et al. 1993),
and
h = 1
was used in the conversion of km s-1 to kpc.
The contribution to the aperture correction from the effect of ![]() is more important than those
for different slit sizes and different galaxy distances.
From Eq. (1) it can be seen that the correction is negative for large or nearby objects (this is the
case for the standard galaxies) and positive for galaxies with
is more important than those
for different slit sizes and different galaxy distances.
From Eq. (1) it can be seen that the correction is negative for large or nearby objects (this is the
case for the standard galaxies) and positive for galaxies with ![]() less than 20 arcsec, which
are smaller than or more distant than a 20 arcsec galaxy at the distance of Coma.
The histogram of the applied aperture corrections in Fig. 4 shows that for the sample galaxies
the correction is positive in most cases.
less than 20 arcsec, which
are smaller than or more distant than a 20 arcsec galaxy at the distance of Coma.
The histogram of the applied aperture corrections in Fig. 4 shows that for the sample galaxies
the correction is positive in most cases.
Copyright The European Southern Observatory (ESO)