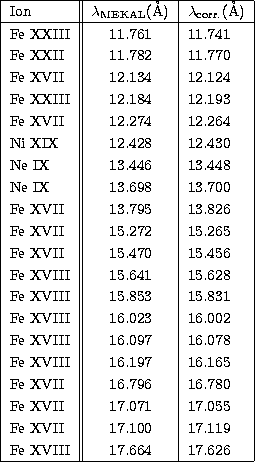
As indicated, the shifts applied to the MEKAL line wavelengths to achieve agreement with SMM flare spectra analyzed here are mostly less than 20 mÅ for wavelengths less than 13 Å, but are often more significant at longer wavelengths. Some longer-wavelength lines needing substantial adjustment are very intense in SMM FCS flare and active region spectra, and can be expected to be significant in spectra of many non-solar objects to be observed by the RGS instrument on the forthcoming XMM spacecraft. We illustrate the effect of MEKAL wavelength adjustments found necessary by this benchmark study by simulating a spectrum of the X-ray-emitting binary star Capella from the RGS instrument (two modules) (cf. Fig. 7). The simulated spectrum has been formed by convolving a MEKAL spectrum having the previous (plotted in Fig. 7 as solid histograms) and adjusted (dotted histograms) wavelengths with the XMM-RGS spectral resolution of about 50 mÅ (FWHM), rather larger than that of the SMM-FCS. As a result, it is evident from the figure that the 10-20 mÅ shifts to intense lines such as the Fe XVII lines near 12 Å and 17 Å will be measurable by the RGS. Another example of a perceptible difference is the comparatively large shift (31 mÅ) needed for the Fe XVII line at 13.826 Å, resulting in a larger separation of this line from the diagnostically important Ne IX triplet of lines near 13.4-13.7 Å. This example therefore shows that the applied wavelength corrections will have a strong impact on the future RGS analysis.
![\begin{figure}
\includegraphics [angle=-90,width=8cm]{xmmsmm1c.ps}
\hspace*{3mm}
\includegraphics [angle=-90,width=8cm]{xmmsmm1d.ps}\end{figure}](/articles/aas/full/1999/14/ds8591/img41.gif) |
Figure 7: Model XMM-RGS spectrum, plotted on a logarithmic intensity scale, of Capella simulated for 40 ks observing time using the MEKAL code with previous (histogram) and adjusted line wavelengths (dotted line with line identifications), illustrating the effects of this benchmark study |
 1 cf. Fig. 7; wavelength corrections from Appendix I. |
Copyright The European Southern Observatory (ESO)