We have calculated a simple line asymmetry factor, ![]() , for
the lines with the highest S/N-ratios, see
Tables A3-A8. It gives the ratio of the
integrated intensities on the red- and blue-shifted sides of the
central velocity (determined by a fit, see Sect. 2.3).
The results are given in Fig. 5. It is clear that the
lines are on average stronger on the red-shifted side, but the
asymmetry decreases with increasing excitation requirements for the
transition (note the markedly lower number of high-quality 1-0 spectra
due to the relative weakness of this line). The mean (median) values
for the 1-0, 2-1, and 3-2 lines are 1.13 (1.16), 1.10 (1.09), and
1.03 (1.03), respectively. A straightforward explanation to the
asymmetry is
self-absorption in an envelope with a negative radial
temperature gradient (as first observed in IRC+10216 by
Olofsson et al. 1982, and
modelled by Huggins & Glassgold 1986). The trend with J-level probably reflects
the fact that the higher-J lines come from regions closer to the star where
self-absorption is less important.
, for
the lines with the highest S/N-ratios, see
Tables A3-A8. It gives the ratio of the
integrated intensities on the red- and blue-shifted sides of the
central velocity (determined by a fit, see Sect. 2.3).
The results are given in Fig. 5. It is clear that the
lines are on average stronger on the red-shifted side, but the
asymmetry decreases with increasing excitation requirements for the
transition (note the markedly lower number of high-quality 1-0 spectra
due to the relative weakness of this line). The mean (median) values
for the 1-0, 2-1, and 3-2 lines are 1.13 (1.16), 1.10 (1.09), and
1.03 (1.03), respectively. A straightforward explanation to the
asymmetry is
self-absorption in an envelope with a negative radial
temperature gradient (as first observed in IRC+10216 by
Olofsson et al. 1982, and
modelled by Huggins & Glassgold 1986). The trend with J-level probably reflects
the fact that the higher-J lines come from regions closer to the star where
self-absorption is less important.
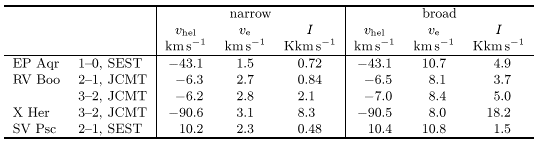
Among our detected stars there are four that clearly show
multi-component line profiles: EP Aqr, RV Boo, X Her, and SV Psc (all
are SRbs). Typically a very narrow feature with a full width less than
![]() 5kms-1 is centered, within the uncertainties, on a much
broader line
5kms-1 is centered, within the uncertainties, on a much
broader line ![]() 18kms-1), see Table 3. The
broad component is close to being parabolic. SV Psc and EP Aqr are maybe
the most extreme examples of this phenomenon. The central peaks are
very narrow, and, if interpreted as arising from expanding envelopes,
they imply expansion velocities of
18kms-1), see Table 3. The
broad component is close to being parabolic. SV Psc and EP Aqr are maybe
the most extreme examples of this phenomenon. The central peaks are
very narrow, and, if interpreted as arising from expanding envelopes,
they imply expansion velocities of ![]() kms-1. In RV Boo,
the only one of these stars for which we have high-quality data in two
lines, the narrow component becomes much stronger (relative to the
broad component) for the higher-frequency transition. Knapp et al.
(1998) recently presented and discussed similar data for nine stars.
kms-1. In RV Boo,
the only one of these stars for which we have high-quality data in two
lines, the narrow component becomes much stronger (relative to the
broad component) for the higher-frequency transition. Knapp et al.
(1998) recently presented and discussed similar data for nine stars.
One possible interpretation of these observations is outlined in Kahane & Jura (1996) where they reported on a bipolar outflow around the nearby XHer. They were able to spatially resolve the blue- and red-shifted lobes of a (weakly collimated) bipolar outflow, while the low-velocity emission, i.e., the narrow component, appears to outline a symmetric envelope. In the case of RVBoo we have obtained data with the OVRO mm-wave interferometer, which partly resolved the CO(2-1) emission from this more distant object. The data suggest that in this case it is rather the narrow component that originates from a bipolar outflow, while the higher-velocity gas comes from a symmetric envelope. However, a final interpretation has to await a more detailed analysis. Knapp et al. (1998), on the other hand, suggest a scenario where episodic mass-loss plays a role.
A similar narrow spike in the middle of a broader line could also be interpreted in terms of emission from a long-lived disk as suggested by Jura et al. (1995) for the post-AGB object the Red Rectangle, and by Kahane et al. (1998) for the silicate carbon star BM Gem.
At this stage no definite conclusions can be drawn, except that it is very likely that these objects are far off the picture of a constant, spherically symmetric mass-loss.
In this section we compare the circumstellar gas expansion velocities
obtained from our data on the SRVs and IRVs with results taken from
the literature for O-rich Mira variables (L93; Y95). The two sources
for the Mira data differ significantly in their selection criteria.
Whereas L93 contains a very inhomogeneous collection from many
different surveys, Y95 is a distance limited survey of visually bright
Miras, i.e., an approach that is quite similar to ours. However, since
only visually classified Miras (GCVS4) were taken from L93, also this data
set provides us with stars of comparable properties. Finally, we note
here that one expects only small systematic errors in the gas
expansion velocity estimates between different studies, as opposed to the
case for the mass-loss rate. If, for an individual object, more than
one independent measurement of ![]() are available the best was
chosen, or, if they are of comparable quality, they were averaged.
The resulting gas expansion velocity distributions are shown in
Fig. 6.
are available the best was
chosen, or, if they are of comparable quality, they were averaged.
The resulting gas expansion velocity distributions are shown in
Fig. 6.
The mean (median) velocities for the three sub-samples are 7.7
(7.9)kms-1 (IRV), 8.8 (8.3)kms-1 (SRV), and 10.0
(8.6)kms-1 (Mira). The main difference between the groups is
the existence of a tail towards high expansion velocities among the
Miras. These are all longer-period Miras as can be seen in
Fig. 7. Of particular interest for mass-loss mechanism
discussions is the high number of stars, in all three groups, with
very low expansion velocities, ![]() km s-1. We
here just mention a few clear examples from our data: the IRVs
V584 Aql, BI Car, and AZ UMa; the SRVs T Ari, RX Lep, L2 Pup,
Y Tel, and BK Vir. The median values obtained for this sample of
O-rich IRVs and SRVs are clearly lower than the corresponding values
obtained by Olofsson et al. (1993) for a sample of
optically bright carbon stars, 10.5 km s-1 and
10.8kms-1, respectively, and in the latter sample (68
objects) there are only two objects with expansion velocity estimates below
5kms-1.
km s-1. We
here just mention a few clear examples from our data: the IRVs
V584 Aql, BI Car, and AZ UMa; the SRVs T Ari, RX Lep, L2 Pup,
Y Tel, and BK Vir. The median values obtained for this sample of
O-rich IRVs and SRVs are clearly lower than the corresponding values
obtained by Olofsson et al. (1993) for a sample of
optically bright carbon stars, 10.5 km s-1 and
10.8kms-1, respectively, and in the latter sample (68
objects) there are only two objects with expansion velocity estimates below
5kms-1.
In Fig. 7 we have plotted the gas expansion velocity as
a function of the pulsation period for our SRV sample and the Miras.
For SRVs below periods of about 200 days there appears to be no trend
in the expansion velocity. For longer periods (![]() , i.e., in the
classical Mira regime) it seems that the expansion velocity increases
with period in the way suggested by Wood (1990, dotted line
in Fig. 7), although there is a considerable scatter. It is
clear that from this point of view the SRVs cannot be a short-period
extension of the Miras. Hence, it seems that the pulsation mode does
not have a drastic influence on the gas expansion velocity.
, i.e., in the
classical Mira regime) it seems that the expansion velocity increases
with period in the way suggested by Wood (1990, dotted line
in Fig. 7), although there is a considerable scatter. It is
clear that from this point of view the SRVs cannot be a short-period
extension of the Miras. Hence, it seems that the pulsation mode does
not have a drastic influence on the gas expansion velocity.
![\begin{figure}
\includegraphics [width=8cm,clip]{ds1694f7.eps}\end{figure}](/articles/aas/full/1999/14/ds1694/img55.gif) |
Figure 7: Gas expansion velocity versus the pulsation period. The symbols denote the variability class |
Line intensity ratios can be deduced, since we have observed more than one transition per star for a number of objects. We have used only high-quality spectra and no upper limits. The results for the 2-1/1-0-ratio are on average 4.2 at SEST (15 objects) and 3.0 at IRAM (2 objects). For the 3-2/2-1- and 4-3/3-2-ratios the results are 1.8 (9 objects) and 1.1 (7 objects), respectively, at JCMT. One may conclude from this that up to the 3-2 line the intensity increases significantly with increasing J-levels. However, the exact increase with J-level is uncertain, since we find an intensity ratio in the 2-1 line between SEST and JCMT of 0.7 (4 objects), possibly indicating a discrepancy in the absolute calibration of this line at either or both telescopes. We find that there is a considerable spread in the intensity ratios (within each group), by more than a factor of three. Parts of this is certainly due to uncertainties in the calibrations (incl. pointing problems, etc.), but the different natures of the sources probably also add significantly to this.
For optically thin emission with equal beam filling one would expect
values of 4, 2.3, and 1.8 for the 2-1/1-0,
3-2/2-1, and 4-3/3-1 line intensity ratios.
Thus, our results indicate optically thin emission for the lower J-lines,
whereas the higher ones start to saturate. It appears therefore that we
observe a very different behaviour than in the case of Mira variables
with optically thick envelopes, where a ratio of 2
is typical for the 2-1/1-0-ratio (Groenewegen et al. 1995).
Groenewegen et al. also found large ratios for their sample of short
period (![]() ), O-rich Miras. They argued that the CO excitation
in thin shells is different, and that possibly radiative excitation
could be more important than the one by collisions.
), O-rich Miras. They argued that the CO excitation
in thin shells is different, and that possibly radiative excitation
could be more important than the one by collisions.
Copyright The European Southern Observatory (ESO)
![\begin{figure}
\includegraphics [width=8cm,clip]{ds1694f5.eps}\end{figure}](/articles/aas/full/1999/14/ds1694/img48.gif)
![\begin{figure}
\includegraphics [width=8cm,clip]{ds1694f6.eps}\end{figure}](/articles/aas/full/1999/14/ds1694/img53.gif)