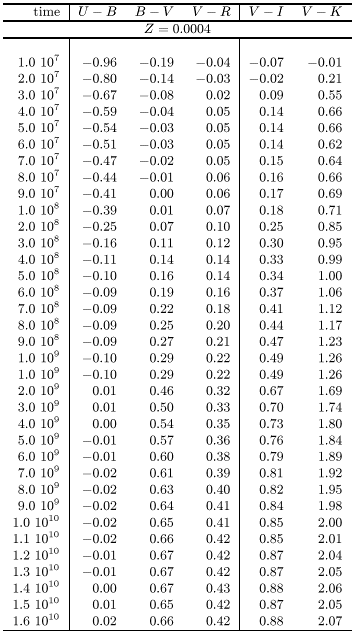
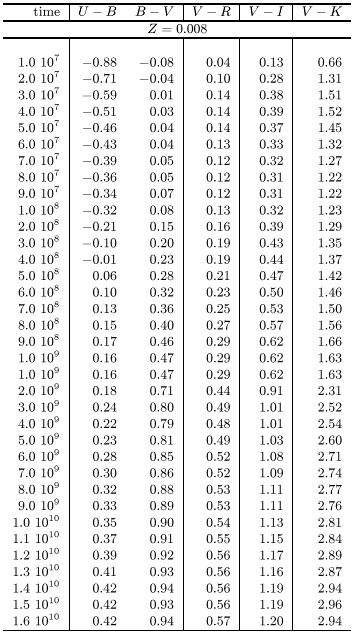
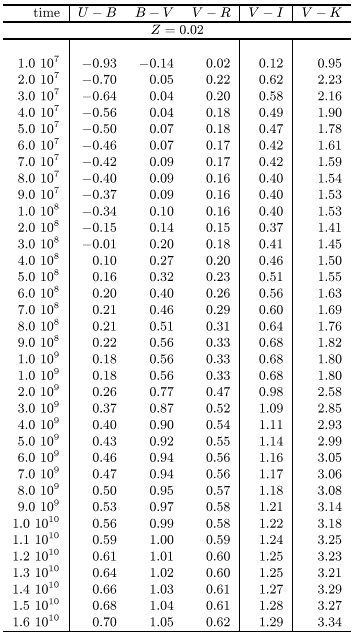
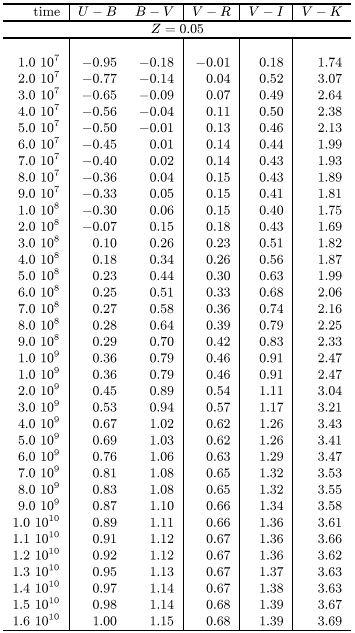
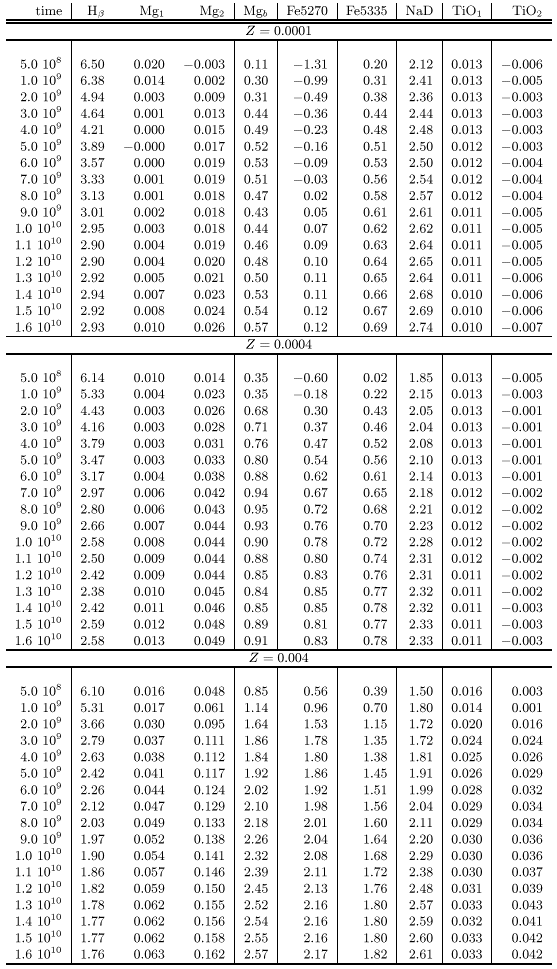
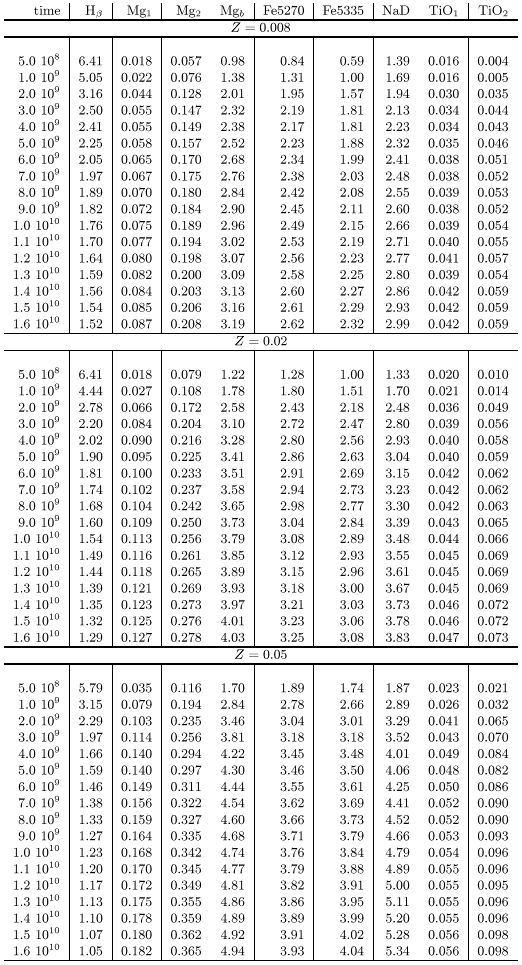
Figures 1 and 2 show the evolution of B-V and V-I versus time of our SSPs on a logaritmic time scale for all metallicities. After a few Gyrs the changes in both colours become very slow, and the metallicity dependence becomes more important. Tables 1 through 3 give the time evolution of all our broad band colours from U to K for 6 metallicities from Z=0.0001 to Z=0.05 for a wide range of ages.
 |
In Figs. 3 and 4 the colours B-V and V-I are shown as a function of metallicity for the models at evolutionary ages of 10, 12 and 15 Gyr together with colors of dereddened GCs from the McMaster catalogue (Harris 1996). In general, we see a good agreement between the models and the observed clusters. The large spread in colour in the observed clusters probably arises from observational errors.
It can also be seen in both models and observations, that for very low
metallicities the colour-metallicity relation cannot be
expressed by a simple linear function. For ![]() , the
relation becomes significantly flatter. The flattening is particularly
pronounced in V-I. The models also show that the (V-I)-metallicity
relation steepens for [M/H] > 0. Very often the metallicity is
calculated for globular cluster systems in other galaxies from V-I
using a simple linear regression line calculated from Galactic
GCs. The models show that this approach is dangerous for metallicities
higher than those of Galactic GCs. A quadratic or higher order fit
would not improve things if calculated for low metallicities and
applied to higher metallicities as it would include further
uncertainties. Therefore a theoretical calibration like the one
provided here is to be preferred.
, the
relation becomes significantly flatter. The flattening is particularly
pronounced in V-I. The models also show that the (V-I)-metallicity
relation steepens for [M/H] > 0. Very often the metallicity is
calculated for globular cluster systems in other galaxies from V-I
using a simple linear regression line calculated from Galactic
GCs. The models show that this approach is dangerous for metallicities
higher than those of Galactic GCs. A quadratic or higher order fit
would not improve things if calculated for low metallicities and
applied to higher metallicities as it would include further
uncertainties. Therefore a theoretical calibration like the one
provided here is to be preferred.
![\begin{figure}
\includegraphics [width=8.8cm,clip]{SSP.time_bv.logtime.ps}\end{figure}](/articles/aas/full/1999/13/ds7606/img32.gif) |
Figure 1: B-V versus time with logarithmic scaling for time (solid line: Z=0.0001, dotted line: Z=0.0004, short-dashed line: Z=0.004, long dashed line: Z=0.008, thick line: Z=0.02, dot-dashed line: Z=0.05) |
![\begin{figure}
\includegraphics [width=8.8cm,clip]{SSP.feh_bv.eta035.ps}\end{figure}](/articles/aas/full/1999/13/ds7606/img35.gif) |
Figure 3:
B-V colour versus metallicity for observerd clusters (stars) from
Harris with E(B-V) < 0.4 and models at 10 (squares) ,12 (diamonds)
and 15 (circles) Gyrs with |
![\begin{figure}
\includegraphics [width=8.8cm,clip]{SSP.feh_mg2.eta035.ps}\end{figure}](/articles/aas/full/1999/13/ds7606/img37.gif) |
Figure 5:
Mg2 versus metallicity for observerd clusters (stars) and models at
10 (squares) , 12 (diamonds) and 15 (circles) Gyrs with |
![\begin{figure}
\includegraphics [width=8.8cm,clip]{SSP.mg2_hbeta.eta035.ps}\end{figure}](/articles/aas/full/1999/13/ds7606/img40.gif) |
Figure 7:
The H |
![\begin{figure}
\includegraphics [width=8.8cm,clip]{SSP.met_mg2.ages.ps}\end{figure}](/articles/aas/full/1999/13/ds7606/img43.gif) |
Figure 10: The Mg2 index against metallicity for various ages. Thin solid line: 0.5 Gyrs, dotted line: 1 Gyr, dashed: 2 Gyrs, long dashed: 4 Gyrs, dot dashed: 8 Gyrs, thick solid line: 12 Gyrs |
![\begin{figure}
\includegraphics [width=8.8cm,clip]{author_comp.mg2.ps}\end{figure}](/articles/aas/full/1999/13/ds7606/img45.gif) |
Figure 12: Comparison of the Mg2 index against age as predicted with our models to those of other authors |
In Figs. 5 and 6 we plot against metallicity the indices Mg2 and Fe5270 from our models and those of Galactic clusters from Burstein (1984). The agreement of the models with the observations is very good over the metalicity range covered by the data. Model calibrations of both Mg2 and Fe5270 as functions of metallicity are almost independent of age for ages close to a Hubble time.
Figure 7 shows the H![]() index against the
Mg2 for Galactic GCs and clusters from M 31. As can be seen in the
figure the
index against the
Mg2 for Galactic GCs and clusters from M 31. As can be seen in the
figure the ![]() index is higher for higher metallicity for the
M 31 GCs than for
the Milky Way clusters. This was already
noted by Burstein (1984)
though the reason for this discrepancy is still unknown.
The models fall right between
the two groups. It can also be seen that
the H
index is higher for higher metallicity for the
M 31 GCs than for
the Milky Way clusters. This was already
noted by Burstein (1984)
though the reason for this discrepancy is still unknown.
The models fall right between
the two groups. It can also be seen that
the H![]() to Mg2 relation is dependent
largely on age. If it were not for the large spread present in the
H
to Mg2 relation is dependent
largely on age. If it were not for the large spread present in the
H![]() observations this index would be a good tool to disentangle
age from metallicity.
observations this index would be a good tool to disentangle
age from metallicity.
The Fe5335 and TiO1 are plotted against Mg2 for observations from Burstein in Figs. 8 and 9 respectively. Both the relations between the Fe5335 and TiO1 indices and Mg2 are virtually independent of model age for ages close to a Hubble time.
In Fig. 10 we show the model index Mg2 against metallicity for a wide range of ages from 0.5 to 12 Gyrs.
Our B-V - colours are very close to those of the BC96 models. This is surprising since they also calibrated their colours with the library from Lejeune. The models from Vazdekis et al. are bluer at all times. They use a different empirical calibration. The B-V - colours for all models seem to converge at high ages.
The calibration of the indices are from Worthey (1994) for all models with the exception of the models from Tantalo et al. (1998), who use the empirical calibrations from Borges et al. (1995) for Mg2 which depend on the [Mg/Fe] ratio.
Our Mg2 indices are lower than those of BC96 and Vazdekis at high ages by less than 0.02 mag, but more close to those of Worthey. Probably due to the different calibrations for their indices, the Mg2 indices of Tantalo et al. are lower than those of all the other models considered here.
Copyright The European Southern Observatory (ESO)

![\begin{figure}
\includegraphics [width=8.8cm,clip]{SSP.time_vi.logtime.ps}\end{figure}](/articles/aas/full/1999/13/ds7606/img33.gif)
![\begin{figure}
\includegraphics [width=8.8cm,clip]{SSP.feh_vi.eta035.ps}\end{figure}](/articles/aas/full/1999/13/ds7606/img36.gif)
![\begin{figure}
\includegraphics [width=8.8cm,clip]{SSP.feh_fe5270.eta035.ps}\end{figure}](/articles/aas/full/1999/13/ds7606/img38.gif)
![\begin{figure}
\includegraphics [width=8.8cm,clip]{SSP.mg2_fe5335.eta035.ps}\end{figure}](/articles/aas/full/1999/13/ds7606/img41.gif)
![\begin{figure}
\includegraphics [width=8.8cm,clip]{SSP.mg2_tio1.eta035.ps}\end{figure}](/articles/aas/full/1999/13/ds7606/img42.gif)
![\begin{figure}
\includegraphics [width=8.8cm,clip]{author_comp.bv.ps}\end{figure}](/articles/aas/full/1999/13/ds7606/img44.gif)