 |
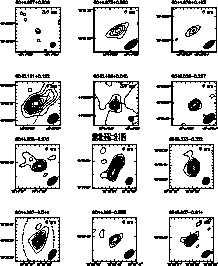
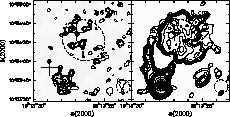
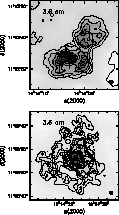
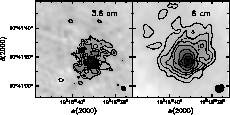
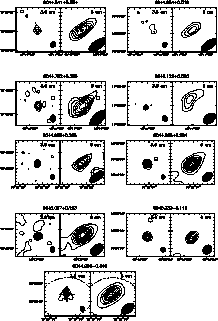
Figure A1: 3.6 and 6 cm maps of the unresolved sources detected at both frequencies; crosses mark the peak positions of 20 cm sources from Zoonematkermani et al. (1990); open sqares mark the positions of the peaks of NVSS sources (Condon et al. 1998), the deconvolved FWHM of these sources are shown as dashed ellipses, which may be partially outside the plotted area |
