

Up: An H catalogue of
Subsections
The science frames have been first bias subtracted.
For each observing run, we have obtained the proper bias by combining several bias
frames with a median filter. Then the images have been corrected for pixel to pixel
response variations. For each night, its own flat field has been constructed by
medianing several flat field frames carried out during the night.
Two different types of flat fields have been used during the three
observing runs:
the first one has been obtained by medianing twilight sky images and it has been used
to reduce the data of 1996. The other one, used in 1995 and 1997 runs, has been
constructed by medianing flat field frames taken on the dome illuminated with twilight
sky. No significant differences have been measured by using the two flat fields.
These two steps of data reduction are based on the NOAO IRAF package, developed at the
Center for Astrophysics.
Finally, cosmic rays and bad pixels have been removed from each frame using Munich
Image Data Analysis System (MIDAS).
The map of the H emission-line flux for each HCG (Himage) has been obtained by removing the contribution of the underlying continuum,
that it is by subtracting the H
emission-line flux for each HCG (Himage) has been obtained by removing the contribution of the underlying continuum,
that it is by subtracting the H from the H
 (Pogge 1992). There are several reasons why the number of
continuum photons per integration time unit passing through the on filter
can be different from the one through the off filter.
For example differences between the transmission curves of the two
narrow-band filters, such as different width and/or
transmission peak; or variations of the sky transparency during the night.
This implies that in order to obtain the H emission-line flux
image a careful estimation of the underlying continuum to subtract
from the H is required.
In practice, the H have to be rescaled to the continuum of
the H wavelength.
Since stars do not show H emission, the number of continuum
photons coming from the stars in each HCG field and passing through the
on and off filters have to be the same.
In-fact, although the on and off filters are sometimes separated by more than 150 Å,
implying that the number of photons coming from the stars is not rigorously the same,
such a difference is negligible.
Thus for each HCG field (and for each couple of filters) we have selected at least three
stars and we have calculated the mean scaling factor K
(Pogge 1992). There are several reasons why the number of
continuum photons per integration time unit passing through the on filter
can be different from the one through the off filter.
For example differences between the transmission curves of the two
narrow-band filters, such as different width and/or
transmission peak; or variations of the sky transparency during the night.
This implies that in order to obtain the H emission-line flux
image a careful estimation of the underlying continuum to subtract
from the H is required.
In practice, the H have to be rescaled to the continuum of
the H wavelength.
Since stars do not show H emission, the number of continuum
photons coming from the stars in each HCG field and passing through the
on and off filters have to be the same.
In-fact, although the on and off filters are sometimes separated by more than 150 Å,
implying that the number of photons coming from the stars is not rigorously the same,
such a difference is negligible.
Thus for each HCG field (and for each couple of filters) we have selected at least three
stars and we have calculated the mean scaling factor K
| 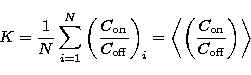 |
(1) |
where  and
and  are the counts from stars in the on and off
image respectively, and N is the number of stars.
Once rescaled, the H have been spatially aligned to the
H.The alignment has been performed by applying the IRAF tasks geomap/geotran
using the position of at least five stars in the field as
reference coordinates.
Finally, after having additively rescaled the on and off images
to the same median value, we have subtracted the Hfrom the H thus obtaining the image of the H
are the counts from stars in the on and off
image respectively, and N is the number of stars.
Once rescaled, the H have been spatially aligned to the
H.The alignment has been performed by applying the IRAF tasks geomap/geotran
using the position of at least five stars in the field as
reference coordinates.
Finally, after having additively rescaled the on and off images
to the same median value, we have subtracted the Hfrom the H thus obtaining the image of the H emission-line flux.
Up: An H catalogue of
Copyright The European Southern Observatory (ESO)